HOT TOPICS LIST
- Strategies
- Stocks
- Buy
- Investing
- Brokers
- Psychology
- Interviews
- Accumulate
- Sell
- Hold
- Spotlight
- Websites
- Candlestick Corner
- Gold & Metals
- Options Trading
LIST OF TOPICS
MARKET COMMENTARY
Bubblenomics 101
12/03/08 02:35:05 PM PSTby Matt Blackman
Can government intervention in markets work?
| Currently, we are experiencing the bursting of the greatest number and size of asset bubbles in history, and such periods have never had a happy ending. But that hasn't stopped governments around the globe from trying every trick they can to stop the rapid price decompression. During the US Presidential campaign of 2008, Democrat competitors spent considerable effort attempting to one-up each other with successively generous bailout suggestions to deal with the economic tsunami sweeping the country. And all candidates blamed the Bush administration for the economic woes we now face. Although the mother of all bubbles formed on Bush's watch and are partly attributable to the actions or inaction of government, Treasury, and Federal Reserve, they were not of George W. Bush's making. As each new bubble formed, from the tech bubble in the 1990s to the latest bubble from 2002 through 2007, the government adamantly denied their existence. But then as the latest bubbles began to pop, many who denied their existence began taking desperate steps to patch them. More disturbing, government reverted to the same actions that helped cause these bubbles in the first place. Notwithstanding this socialization of Wall Street, we still live in a free market society, and it is not the government's job to make it work. History tells us that the periods following bubble implosions are directly proportional to the size and scope of the bubble and take years, sometimes decades, to heal. In other words, the higher asset prices climbed, the longer and more painful the aftermath. By the end of November 2008, more than $8 trillion in various bailouts, packaged stimuli, and loan guarantees had been offered by the US government, with roughly 60% of that coming from the Federal Reserve, according to Bloomberg magazine. And this was before the introduction of additional programs promised by the incoming Barack Obama administration. How much damage was done and can such programs stop the hemorrhaging?
|
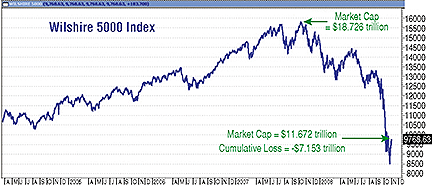
| NEEDLE AND THE DAMAGE DONE Since peaking in late October 2007, Figure 1 shows how badly stocks were pummeled. Total market capitalization for the Wilshire 5000, the broadest measure of North American stocks, peaked at $18.73 trillion at the end of October 2007. But by Halloween in 2008, the index had lost nearly 40%, carving more than $7 trillion in total from US market capitalization (see Figure 1). Global losses, however, were far higher.
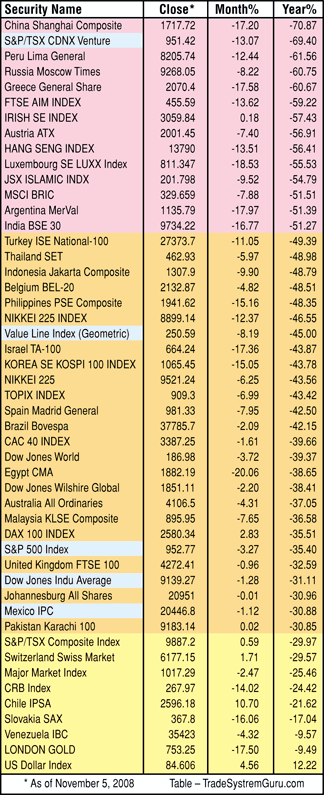
As we see from Figure 2, the damage on this side of the Atlantic and Pacific seems modest in comparison with other markets, and as we see, no part of the globe has been spared. Chinese stocks suffered the greatest damage after dropping more than 70% in the last year. More than a dozen international stock indexes lost in excess of 50% (red). Markets losing between 30% and 50% (orange) included the Value Line Geometric, the Standard & Poor's 500, Dow Jones Industrial Average (DJIA), and Mexican IPC (highlighted in blue). The Toronto TSX Composite has fared better, thanks mostly to the fact that it is rich in commodity stocks, but now that commodities are falling, the index could see losses accelerate.
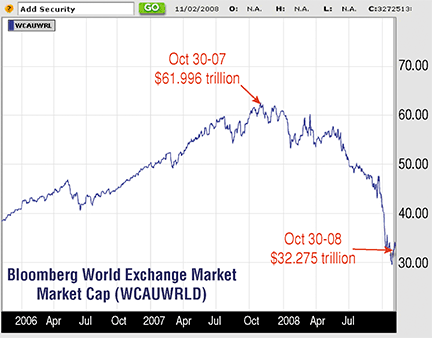
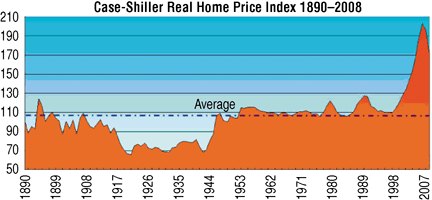
Figure 3 (of the Bloomberg World Exchange of market capitalization for global stocks) shows the extent of the losses around the world. After peaking on October 30, 2007, at $62 trillion, stock values plummeted nearly $30 trillion over the following year, more than four times the losses in US markets. According to Kyle Bass of Hayman Advisors, in the US alone, with Lehman, AIG, Bear Stearns, Fannie Mae, Freddie Mac, WaMu, Countrywide, and the rest of the companies that have failed to date, there are another $8 trillion of assets already in receivership, conservatorship, liquidation, and backed by the taxpayer. He also expects to see at least $1 trillion of corporate debt default over the next two years. VALUE CHALLENGE By August 2008, residential real estate prices in the US had fallen more than 20% from their peak in 2006, according to the Case-Shiller home price index. Considering that the total value of residential real estate was $21 trillion at its peak, this translates into a loss for US homeowners of $4.2 trillion and counting. Economist Nouriel Roubini estimates that losses stemming from the subprime mortgage market will now be "closer to $3 trillion." CS Index cofounder Robert Shiller has collected inflation-adjusted home prices across the country for more than 100 years and calculated an index that fluctuated between 80 and 130 in the 19th and 20th centuries. In the first 110 years, home prices basically kept up with inflation, rising above their historical average during good economic times and dropping below during deflationary periods and recessions.
|
| But something new began to emerge in 2000. After hitting an index value of 128, which was the prior inflation-adjusted high reached, prices kept moving up over the next six years until they had risen above 202, nearly 60% above their previous all-time high (Figure 4). In other words, even though prices in the US have fallen over 20%, home prices still have to fall more than 32% just to get back to highs reached in previous peaks and more than 60% to return to their historical average price!
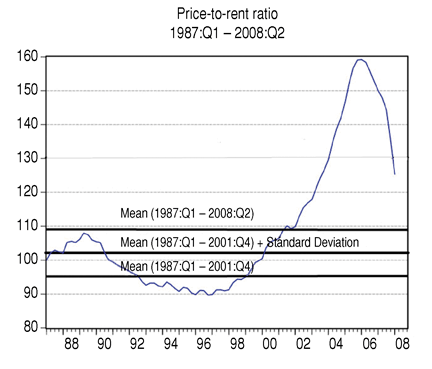
This contention is supported by other historical real estate metrics. As we see in Figure 5, home prices still have a long way to fall in relation to rents. To return to the average home price to rent ratio, home prices still have to fall at least 12% further nationwide or rents would have to increase roughly 15%, the former being much more likely than the latter in a recession.
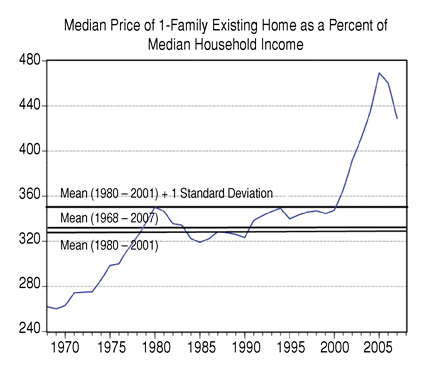
Next, we see a chart of the ratio of the value of the family home as a percentage of household income (Figure 6). Prices still have a long way to fall to return to normal compared to median incomes as well. It is clear that residential property prices are still high -- too high to be sustainable. PRIMING THE ELECTION PUMP In light of Lehman's credit derivative swap auction, it became clear that these assets weren't worth anything near their stated value. As we learned from the auction, the Lehman assets weren't worth $200 billion. They weren't even worth $40 billion -- they were only worth 8.625 cents on the dollar. How many other financial companies, banks, lenders, and corporations are in similar financial straits but just haven't told us yet? The problem, according to Bass, is that many corporations were simply making up values on their assets. History tells us that the two years leading up to an election is the most important time for any government. If the economy is robust as voters head to the polls, there is a good chance that the incumbent party will be elected or reelected. If not, their chances of winning are poor. And stimulus programs during preelection periods have had a powerful effect on markets throughout history. A strategy to buy the 30 companies of the DJIA at the midterm low 26 months before the election and selling after the election captured 93% of all DJIA gains between 1902 and 2006, compared to just 7% in the 22 months after the election. And our study showed that this election effect is getting more powerful. But every stimulus program has a price. Since World War II, with the exception of the relatively brief 1987 correction, every serious bear market and recession has occurred in the two-year post-election period as the government worked to right the excesses built up during the preelection party. After nearly every election, it has taken two years of pain just to get the economy back on track again. Actions taken by the Bush administration during the final two years, especially in the final months leading up to the election, are a case in point. Unfortunately, even though the government outdid itself compared to previous preelections in an attempt to fix our broken economy, the trillions of dollars have so far achieved little of the desired effect. So far, more than $8 trillion have been thrown into the economy to try to stop the massive asset repricing now under way. But even this incredible amount pales compared to the losses at home and abroad.
|
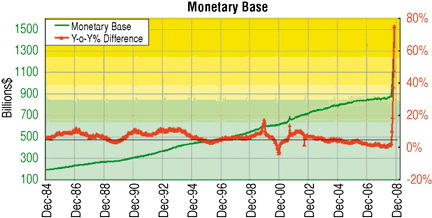
| As we see from Figure 7, in the weeks leading up to the election, the Fed cranked the money presses into high gear, pumping roughly 75% more money into our economy to try to fix the problem. The fed funds rate dropped below 1% and the government did their best to force banks to spread the money around. The government and the Fed are nearing the end of their resources to stimulate the economy. So far, such tactics haven't worked, but somehow, geniuses in government think more of a bad thing will actually be good. What's the definition of insanity? Now that the government is running out of options and money, it has been estimated that the budget deficit will soar from $400 billion in 2008 to more than $1 trillion in 2009. How will the government (and the Fed) get what it needs? Based on the current situation, it won't be raised domestically. Even during the good times, our national savings rate was negative. We have become dependent on the generosity of foreigners to finance our standard of living and keep our interest rates low. But this free ride may be coming to an end sooner rather than later and has the potential to drive interest rates into the stratosphere. But even with interest rates (the effective fed funds rate) near zero, people are losing their jobs in increasing numbers. Unemployment hit 6.5% in October, a level not seen since 1994. At the current rate of job losses, it may not be long before we reach the 9.5% peak, reached in 1982 during the last severe recession. If anything, consumers, who are the main drivers of our economy, will need to spend whatever savings they have to pay the mortgage or the rent and buy necessities. Will the Chinese and Japanese, who have been the major buyers of US Treasuries, continue to support our economy even though their own economies are suffering slowdowns? But now, instead of their buying $33 billion of our Treasuries every month, we will need them to buy more than $80 billion monthly, given current budget deficit projections of more than $1 trillion. However, the Chinese are now getting into the bailout act. They announced a $586 billion plan of their own in early November 2008, and every dollar spent at home means a dollar less to lend to the US. And other emerging nations are joining in the bailout game. It is looking more as if our government will have to learn the painful truth the hard way. It is financial folly to try to stop the massive repricing when an asset bubble breaks. It's like trying to stop a runaway freight train. But more important, bailouts transfer the losses from those in the private sector who made bad investments to the taxpayers, many of whom were responsible borrowers and did not take on unmanageable levels of debt. As the Japanese learned, trying to fix the problem through government bailouts and using creative accounting to hide or bury losses versus letting financial gravity take its course only prolongs the pain. TAKING THE LOW ROAD As a best-case scenario, we risk years of anemic economic performance, a rapidly declining dollar combined with stagflation, and an eventual spike in interest rates as foreigners avoid dollar-denominated assets in search of those that are realistically priced. If these bailouts fail, and they will if history is any guide, we can expect a continuation of extreme levels of volatility as markets swing between periods of euphoria as new stimulative plans are announced and then depression as prices plummet and the realization hits home that the latest plan has failed. |
| SUGGESTED READING |
Matt Blackman is a full-time technical and financial writer and trader. He produces corporate and financial newsletters, and assists clients in getting published in the mainstream media. He tweets about stocks he is watching at www.twitter.com/RatioTrade Matt has earned the Chartered Market Technician (CMT) designation.
| E-mail address: | indextradermb@gmail.com |
PRINT THIS ARTICLE

Request Information From Our Sponsors
- StockCharts.com, Inc.
- Candle Patterns
- Candlestick Charting Explained
- Intermarket Technical Analysis
- John Murphy on Chart Analysis
- John Murphy's Chart Pattern Recognition
- John Murphy's Market Message
- MurphyExplainsMarketAnalysis-Intermarket Analysis
- MurphyExplainsMarketAnalysis-Visual Analysis
- StockCharts.com
- Technical Analysis of the Financial Markets
- The Visual Investor
- VectorVest, Inc.
- Executive Premier Workshop
- One-Day Options Course
- OptionsPro
- Retirement Income Workshop
- Sure-Fire Trading Systems (VectorVest, Inc.)
- Trading as a Business Workshop
- VectorVest 7 EOD
- VectorVest 7 RealTime/IntraDay
- VectorVest AutoTester
- VectorVest Educational Services
- VectorVest OnLine
- VectorVest Options Analyzer
- VectorVest ProGraphics v6.0
- VectorVest ProTrader 7
- VectorVest RealTime Derby Tool
- VectorVest Simulator
- VectorVest Variator
- VectorVest Watchdog

