HOT TOPICS LIST
- Strategies
- Stocks
- Buy
- Investing
- Brokers
- Psychology
- Interviews
- Accumulate
- Sell
- Hold
- Spotlight
- Websites
- Candlestick Corner
- Gold & Metals
- Options Trading
LIST OF TOPICS
TRADER'S NOTEBOOK
A Collapse Or A Bubble?
01/12/09 10:10:15 AM PSTby Thomas Maskell
Or the opportunity of a lifetime?
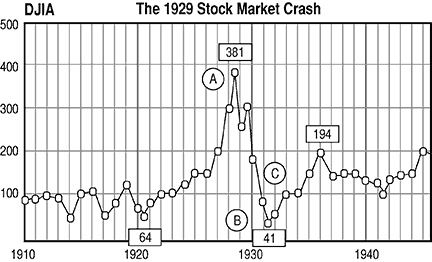
| Be afraid. Be very afraid! The politicians are coming to save us. Whenever they turn their attention toward the free market, it's time to keep a wary eye, prepare for a bumpy ride, and hang onto your wallets. The only people who are likely to be saved are themselves and their friends. You will be on your own. This latest downturn in the stock market is no exception. To survive this onslaught of do-goodism by our politicians, you will need a clear perspective of what has happened and what is going to happen. The stock market is all about the future. A successful investor is a seer, and a successful seer is mindful of history. So in this two-part view of today's market, we shall put this current market downturn into historical context and look into the future to determine a reasonable course of action. THE CRASH OF 1929 Figure 1 charts the Dow Jones Industrial Average (DJIA) from 1910 to 1945. This encompasses the 1929 crash with enough pre- and post-years to place it in perspective. The perspective we are looking for is a technical one. We are not interested in the fundamentals or the financials or the exuberance of the margin buyers. We are only interested in what the chart says. The chart will always tell us what happened with factual certainty. We will leave the uncertainty of the "whys" to the pundits. What happened in 1929 was that the stock market was chugging along in a modest trading channel from 1910 to 1923: a sane and sensible pattern, given the nature of the US economy. Then the 1920s began to roar and the stock market jumped out of its channel in 1924 and skyrocketed to its peak — 391 — in 1929. You don't have to be an accomplished chartist to guess what happened next. The bottom fell out, the market collapsed, and the economy fell into depression. Of course, this didn't all happen overnight. It wasn't until 1932 that the bear market went into hibernation with a DJIA of 41. Around then, the US economy began slipping into the Great Depression. The exuberance of the Roaring Twenties and the collapse of the stock market have cast a shadow over the US economic psyche that is still visible today. But look closely at Figure 1. Did the market collapse? Or did a bubble burst?
|
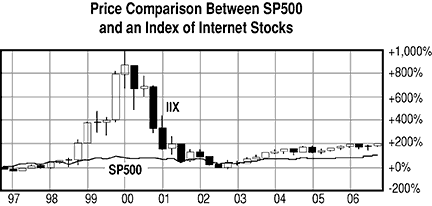
 FIGURE 2: THE INTERNET BUBBLE. Here you see a comparison between the Internet stocks and the S&P 500. By 2000 the Internet stocks outperformed the broader market tenfold. This bubble burst in 2000, and the Internet stocks fell back in line with the S&P 500. BURSTING BUBBLES AND THE INTERNET How did they get so out of whack? The answer is: Who cares? The whys are always different; the result is always the same. In the case of the Internet, it was a mix of new technology, misguided hype, and faulty metrics. People bought unprofitable dotcoms based on measurements such as price-to-sales ratios and burn rates. The pundits were proclaiming a "new economy," where profits were passe. However, no matter how much the pundits protest reality, they cannot change it. Profits do matter, and the dotcoms burned themselves out. The bubble burst. However, for our purposes, the bubble is not the whole story. The story is in the aftermath. After the Internet bubble burst, the stocks began to follow a course that was a reasonable reflection of the Internet's potential. From 2002 to 2006, Internet stocks grew at twice the rate of the S&P 500, which was reasonable for the Internets, given their status as an emerging market. If you had the foresight and courage to buy into the Internet boom after the pop (mid-2002), by 2007, you would have quadrupled your money, a more than 40% annual rate of return.
|
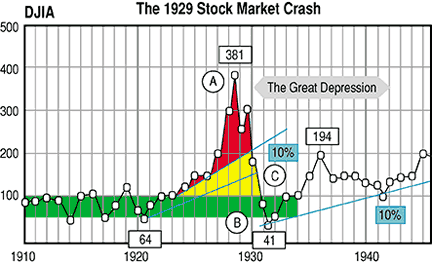
| 1929 REVISITED Keeping that recent bubble in mind, let's revisit the crash of 1929. Again, the "whys" are numerous, but the result is the same. So let's add a couple of trendlines to the raw price data in Figure 1 to get Figure 3, and it is easy to see that the stock market didn't really crash in 1929. It bubbled and then burst. Even if you believed the hype surrounding the Roaring Twenties and operated on a 10% uptrend assumption (blue lines) rather than the historical trading channel of the early 1900s (green area), the market was clearly inflated by 1927. The problem was exacerbated in 1928, and then finally, the day of reckoning arrived in 1929. While it has often been stated that during the 1929 crash the market lost 89% of its value over two years (381 to 41), a more honest appraisal would be that the market fell 36% below the low point of its historical trading channel (64 to 41). This 36% correction is hardly a catastrophe. And once the novices were driven from the market, the sane and sensible took over. The market corrected the correction and then found its footing on a long-term growth path of 10%, a path that is still traveled today. |
| ARE THERE LESSONS TO BE LEARNED? A bursting bubble is a dramatic event, yet it is also very predictable and finite. In both examples, the event ended when the market fell back to its historical trend. Granted, the fall overshot the trend, but the overshoot was temporary and the trend quickly reestablished. This is not the case in a collapse. When a market collapses, there is no natural endpoint and no expected aftermath. The market that rises out of the ashes of a collapse is unpredictable and establishes a new paradigm. So the question surrounding this market: Is this current downturn a collapse or a bubble? Current and past articles from Working Money, The Investors' Magazine, can be found at Working-Money.com. |
Thomas Maskell is a frequent S&C contributor whose recent book, The Complete Guide to Investing During Retirement, provides an excellent primer on investing, trading and speculation in the stock market. It is available nationwide. To comment on this article or his book, contact him at Retireestocks@aol.com or visit his blog at retireestocks.blogspot.com.
| E-mail address: | Retireestocks@aol.com |
PRINT THIS ARTICLE

Request Information From Our Sponsors
- VectorVest, Inc.
- Executive Premier Workshop
- One-Day Options Course
- OptionsPro
- Retirement Income Workshop
- Sure-Fire Trading Systems (VectorVest, Inc.)
- Trading as a Business Workshop
- VectorVest 7 EOD
- VectorVest 7 RealTime/IntraDay
- VectorVest AutoTester
- VectorVest Educational Services
- VectorVest OnLine
- VectorVest Options Analyzer
- VectorVest ProGraphics v6.0
- VectorVest ProTrader 7
- VectorVest RealTime Derby Tool
- VectorVest Simulator
- VectorVest Variator
- VectorVest Watchdog
- StockCharts.com, Inc.
- Candle Patterns
- Candlestick Charting Explained
- Intermarket Technical Analysis
- John Murphy on Chart Analysis
- John Murphy's Chart Pattern Recognition
- John Murphy's Market Message
- MurphyExplainsMarketAnalysis-Intermarket Analysis
- MurphyExplainsMarketAnalysis-Visual Analysis
- StockCharts.com
- Technical Analysis of the Financial Markets
- The Visual Investor


