HOT TOPICS LIST
- Strategies
- Stocks
- Buy
- Investing
- Brokers
- Psychology
- Interviews
- Accumulate
- Sell
- Hold
- Spotlight
- Websites
- Candlestick Corner
- Gold & Metals
- Options Trading
LIST OF TOPICS
TRADER'S NOTEBOOK
Where Do We Go From Here?
01/28/09 10:12:42 AM PSTby Thomas Maskell
Are we hurtling toward a crash or a bubble?
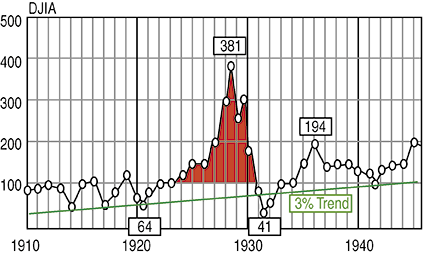
| In my previous article, I discovered that the great stock market crash of 1929 was not really a crash, but a bubble. What's the difference? If a market crashes, its endpoint is unpredictable. A crash marks the beginning of a new paradigm. And because the paradigm is new, it is uncertain. And as we all know, uncertainty is the great bugaboo of the stock market. A bubble, on the other hand, is not the beginning of something new but a return to what is proven, defensible, and sane. Thus, when a bubble breaks, its endpoint is predictable. This is not to say that the market will not overreact and penetrate this rational base; it may do what it did in 1932, when it penetrated the base established in the early 1920s. But that overreaction quickly corrected with a return to the market's historical trading channel that was established and supported at the turn of the century. So what does all this tell us about today's market? THE BUBBLE BURSTS
|
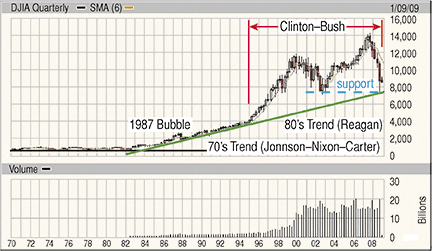
| The support in Figure 1 occurs at approximately 7200. Similar support levels can be determined for the Standard & Poor's 500 (about 820) and the NASDAQ (900 to 1500). These levels define the bottom of the bubble and the return to normalcy. Once these levels are reached, there is a reasonable expectation that the market will either channel or continue along its long-term trendline. Of course, dramatic developments in the economy could drive the market lower or halt the correction. However, the fundamental dynamic is not altered by these short-term anomalies. Once support is reached, the market is ripe for reentry.
|
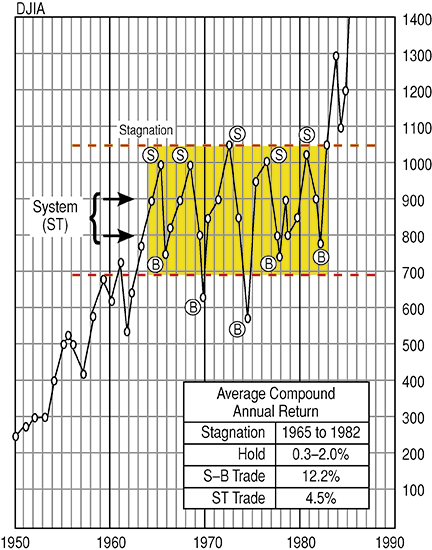
| NOW WHAT? While we may be reasonably confident that this market is close to the bottom, we are still left with the question of what we should do now. Two answers are possible. The market could channel as it did in the 1970s (Figure 3), or it could return to trend as it did in the 1930s (Figure 2). Both scenarios occurred during periods of economic stress. So what can we expect this time? I think it will channel. Why? The answer is not in the stress. It is in the solution. In the late 1970s, Jimmy Carter was President and his solutions to the country's economic problems were bigger government, more socialism, and calls for sacrifice. These are not free-market, growth-oriented, or capitalist-friendly prescriptions. Yet the US did not balk at these gloomy intrusions until Carter's prescriptions delivered more disease than cure. It was Ronald Reagan, the succeeding President, who broke the socialist mindset and released the country's entrepreneurial spirit. It also freed the stock market from its trading channel (note Figure 1). Contrary to mythology, President Franklin Roosevelt's response to the 1929 bubble was closer to Reagan's response than to Carter's. FDR believed in the American people, the American system, and the American way of life. But he realized that there are times when the government must place its finger on the economic scale — sometimes on the side of demand, as he did, and sometimes on the side of supply, as Reagan did. It is a lesson that most politicians have failed to learn — the solution to our economic problems lies in freedom, not fiefdom. President Barack Obama appears to be in the Jimmy Carter camp by pursuing a governmental solution to a free-market problem. The most likely outcome to this will be Carteresque — a massive trading channel in the stock market. So let's look at that channel in Figure 3. CHANNEL SURFING Depending on when he entered that 1970s channel, the annual return for the buy & hold investor was as low as 0.3% but not more than 2%. The 1970s was not a very rewarding period for investors. If the next four to eight years promise the same, what should investors do? Here's a possibility: trade. There is a contradiction in that investors are not traders. Their inclination is to analyze, buy, and hold. But what if we were to add a wrinkle to that? What if you were to analyze, buy and sell, and then buy again — a kind of modified hold?
|
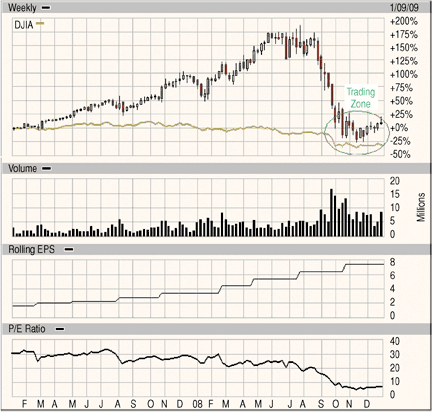
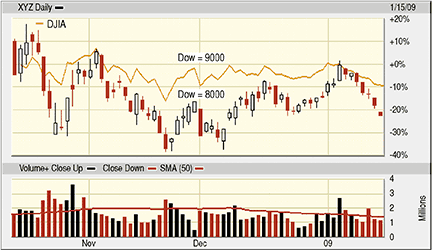
| Figure 4 compares the stock chart of an unnamed company (XYZ) to the current Dow Jones Industrial Average (DJIA). Note that the long-term earnings (EPS) and price performance of XYZ are extremely bullish and rational until it succumbs to a plunging DJIA. Once knocked off its pedestal, it began to track the DJIA as the DJIA began to channel between 8,000 and 9,000. Figure 5 provides a closer view of this phenomenon.
|
| It's clear from Figure 5 that there is a strong correlation between the swings of the DJIA and the price swings of XYZ. No fancy technical analysis is required. Based on the fundamentals, the stock is a good buy at this level. Based on the chart, however, there is a lot to be gained by buying this stock when the DJIA hits 8000 and selling when it rebounds to 9000 and then doing it all over again when the DJIA channels. How long will the DJIA channel and this correlation last? We don't know! But what is the worst that can happen? You are buying the stock primarily on the fundamentals and your sense that the market has bottomed. You sell if the DJIA fails to break through 9000. If it breaks out, you have caught the bottom. If it doesn't, you have made a positive trade and positioned yourself to make another. If you buy and the DJIA breaks support, you'll need to sell quickly. You'll also need to ask yourself if the DJIA is establishing a new channel, simply widening the old one, or going to a new low. By selling quickly, you can repurchase the stock when that new low or channel is established. Granted, as an investor, this is not your style. But if the market channels for any length of time, as it did in the 1970s, it may be your only chance to grow (or recover) your nest egg within a reasonable time frame. But remember, you are an investor, not a trader. If the fundamentals fail, abandon the stock and find another. There may be profit in the chart, but there is safety in the fundamentals. SUGGESTED READING |
Thomas Maskell is a frequent S&C contributor whose recent book, The Complete Guide to Investing During Retirement, provides an excellent primer on investing, trading and speculation in the stock market. It is available nationwide. To comment on this article or his book, contact him at Retireestocks@aol.com or visit his blog at retireestocks.blogspot.com.
| E-mail address: | Retireestocks@aol.com |
PRINT THIS ARTICLE

Request Information From Our Sponsors
- VectorVest, Inc.
- Executive Premier Workshop
- One-Day Options Course
- OptionsPro
- Retirement Income Workshop
- Sure-Fire Trading Systems (VectorVest, Inc.)
- Trading as a Business Workshop
- VectorVest 7 EOD
- VectorVest 7 RealTime/IntraDay
- VectorVest AutoTester
- VectorVest Educational Services
- VectorVest OnLine
- VectorVest Options Analyzer
- VectorVest ProGraphics v6.0
- VectorVest ProTrader 7
- VectorVest RealTime Derby Tool
- VectorVest Simulator
- VectorVest Variator
- VectorVest Watchdog
- StockCharts.com, Inc.
- Candle Patterns
- Candlestick Charting Explained
- Intermarket Technical Analysis
- John Murphy on Chart Analysis
- John Murphy's Chart Pattern Recognition
- John Murphy's Market Message
- MurphyExplainsMarketAnalysis-Intermarket Analysis
- MurphyExplainsMarketAnalysis-Visual Analysis
- StockCharts.com
- Technical Analysis of the Financial Markets
- The Visual Investor

