HOT TOPICS LIST
- Strategies
- Stocks
- Buy
- Investing
- Brokers
- Psychology
- Interviews
- Accumulate
- Sell
- Hold
- Spotlight
- Websites
- Candlestick Corner
- Gold & Metals
- Options Trading
LIST OF TOPICS
CHARTING
Keeping In Mind Support And Resistance
04/29/09 02:32:19 PM PSTby Danish Kapur
Clarifying the terms "support" and "resistance" can make all the difference for your trading.
| What are support and resistance levels and how can you use them in your trading? Take a look at any price chart. Note those areas where trending prices stop and reverse direction. These areas where the trend reversed are typically known as support and resistance. The area where a downtrend reversed is known as the support level. You can think of it as the point at which the bulls won the battle and became more dominant than the bears. Similarly, the resistance level is where an uptrend reversed. In this case, you can think of it as the point at which the bears took over and became stronger than the bulls. Support and resistance levels keep exchanging their roles. When a support level is broken it starts acting as resistance, and when resistance is overcome it acts as support for prices going forward. APPLYING THEM
|
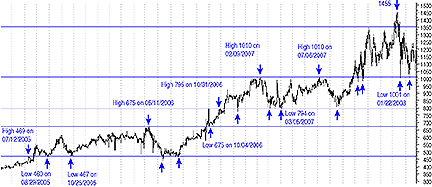
| Take the example of ICICI Bank (Figure 1). On July 12, 2005, ICICI made a high of 469 and corrected from there. This high of 469 is an important point, a pivot point. Once the 469 level is crossed, the best trade would be to buy with a stop at a recent low. Keep in mind that once price breaks above the resistance of 469, that area (469 + - 2%) will become a support level for future price movements. On the chart you can see how this works. The stock corrects but bottoms around 460 on August 29, 2005. You can buy in the range previously described in anticipation that this support zone will hold and stock will bounce back. As you can see, this is what happened, and later, when the stock declined, it did not break this support but bottomed out at 467 on October 25, 2005. It is important to note that the more times prices hit a support level and bounce back, the more important that a support level becomes for future price movement. Going back to the chart, you can see that on May 11, 2006, the stock made a high at 675 and again corrected at a price range of 460470. So you could buy in anticipation that this range wont break. But always keep in mind that there is no guarantee for that and price could break below the support level, so if you are going to place a buy order, remember to place a stop. From the chart, you can see that the support level held and the price did indeed move up. In late September 2006, the price crossed above the previous high of 675, which at this time was acting as a resistance level. Once price crossed above 675, it was likely that the 675 level would start acting as support. On October 4, 2006, price fell and made a low of 675 before moving up. On October 31, 2006, the price of ICICI Bank halted for a few days, making a high at 795, which is a potential resistance level. Upon crossing 795 in mid-November 2006, that level started acting as support. So each time a resistance level was crossed, you should move your stop to the newly formed support. This isbecause the resistance would now act as support. On February 9, 2007, after making a high at 1010 the price of ICICI Bank dropped, hitting a low at 794 on March 5, 2007. You could add long positions in anticipation of an up move. This strategy proved profitable as the stock moved up but halted again at the previous high of 1010 on July 6, 2007. Experienced traders can think of booking profits in this region and buying back again either close to 794 or above 1010. Moving forward, you can see that price moved sideways for a few days without going above 1010. It then dropped to the support area of 794 or thereabouts. As I mentioned earlier, the more a support level comes into play, the stronger it becomes. So you could again buy close to 794 and sell your position at around 1010. Once price approaches 1010, you can start booking profits because you really do not know whether or not the 1010 level will be crossed. If prices cross above the 1010 level, you can buy again and place your stop at 1010 (2% range) that is, in the 9901010 range. This 9901010 range acts as a strong support area since prices fell to this level in January 22, 2008, after making a high of 1455. FOLLOW THE MARKET SUGGESTED READING |
Danish Kapur is a trader, author, and commentator. He may be reached at www.danishkapur.com.
| Website: | www.danishkapur.com |
PRINT THIS ARTICLE

Request Information From Our Sponsors
- StockCharts.com, Inc.
- Candle Patterns
- Candlestick Charting Explained
- Intermarket Technical Analysis
- John Murphy on Chart Analysis
- John Murphy's Chart Pattern Recognition
- John Murphy's Market Message
- MurphyExplainsMarketAnalysis-Intermarket Analysis
- MurphyExplainsMarketAnalysis-Visual Analysis
- StockCharts.com
- Technical Analysis of the Financial Markets
- The Visual Investor
- VectorVest, Inc.
- Executive Premier Workshop
- One-Day Options Course
- OptionsPro
- Retirement Income Workshop
- Sure-Fire Trading Systems (VectorVest, Inc.)
- Trading as a Business Workshop
- VectorVest 7 EOD
- VectorVest 7 RealTime/IntraDay
- VectorVest AutoTester
- VectorVest Educational Services
- VectorVest OnLine
- VectorVest Options Analyzer
- VectorVest ProGraphics v6.0
- VectorVest ProTrader 7
- VectorVest RealTime Derby Tool
- VectorVest Simulator
- VectorVest Variator
- VectorVest Watchdog

