

HOT TOPICS LIST
- Strategies
- Stocks
- Buy
- Investing
- Brokers
- Psychology
- Interviews
- Accumulate
- Sell
- Hold
- Spotlight
- Websites
- Candlestick Corner
- Gold & Metals
- Options Trading
LIST OF TOPICS
THE CHARTIST
Has The Gold Vein Dried Up?
09/23/09 03:05:03 PM PSTby Ron Walker
Many investors have given up on gold at these extended levels, thinking that it is all tapped out. But certain technical signs suggest that we may soon be ushered into the next phase of the gold rush.
| In Dale Carnegie's 1937 book about people skills called How To Win Friends And Influence People, he tells the story of a New York insurance broker in the 1880s named RU Darby who got gold fever. Subsequently, he went west to Colorado with his uncle to make his fortune in gold. He became a prospector, and eventually after a lot of hard, backbreaking work, they discovered a very rich vein in the Rocky Mountains and began mining it. Then, realizing that they needed heavy machinery to continue the excavation, Darby and his uncle returned back East, where he convinced his friends to invest in his mining operation, and a new corporation was born. JUST THREE FEET SHORT The junk dealer decided to hire a geologist to study the mine, to see if the vein had in fact dried up. After close examination and inspection of the mine, the geologist advised the dealer to drill three feet from the point where Darby had stopped, and he'd rediscover the gold vein. The geologist assured the dealer that the previous owners were just unfamiliar with the fault lines of the mine, and that was why they couldn%91t find where the vein resumed. The geologist proved to be correct in his analysis, and the junk dealer became the richest man in Colorado. Darby had given up prematurely after convincing himself that the mine was tapped out. Darby went down in defeat, having stopped three feet from the mother lode, unaware of how close he was to success. He gave up too soon, only three short feet away from a fortune. Similarly, investors might be prematurely throwing in the towel on GLD. After a long period of consolidation in 2009, it has positioned itself to begin drilling away at resistance, which may result in the rediscovery of a renewed advance. INVERSE HEAD & SHOULDERS |
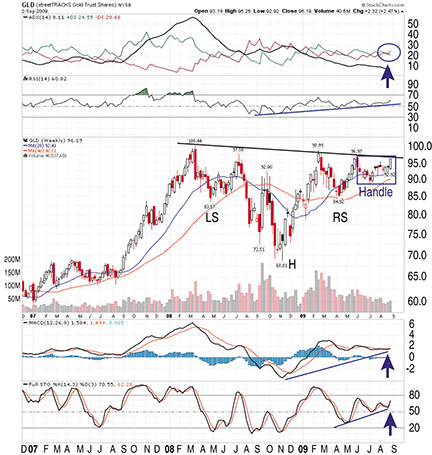 FIGURE 1: GLD, WEEKLY. The weekly chart of GLD needs to drill through the neckline of resistance. Once that occurs, it will renew the advance on the gold ETF. Prices are showing strength as the strong support as they hover above the 20- and 40- week moving averages. |
| Over the course of 2008 and all of 2009, a very large inverse head & shoulders (H&S) price pattern set up on GLD’s weekly chart (Figure 1). The neckline of the pattern is sloping down, producing a trendline that is slightly declining but still running horizontally. Upon completion of the pattern, after the right shoulder formed, the bulls got cold feet as prices hesitated at resistance in early June and then suddenly pulled back. The pullback at resistance carved out a handle on the large reversal pattern. Often, after a prominent reversal pattern is completed, prices drift downward and form another higher low to shake out weak longs. After the downward spiral concludes, prices will inch their way back up to test resistance again. Handles form on many patterns but are mostly associated with cup patterns. Should the inverse H&S pattern play out, the measurement is calculated by taking the difference between the high and the low of the pattern. This measures 31 points, giving a minimum objective target to about the $128 level. If the handle fails, and prices crumble below the last significant low of $88.82 made in early July (the momentum low of the handle), it would destroy the pattern. But technical indicators on the weekly chart of GLD appear to agree with the reversal pattern, which will likely produce a bullish outcome. For instance, the average directional movement index (ADX) (14) has fallen below both directional movement indicators (+DI and -DI) and is bottoming out. Once it does so and begins to rise again, should the +DI line be above the -DI line, a new major uptrend will be born. The +DI line just crossed above the -DI line, generating an early buy signal, suggesting that the inverse head & shoulders pattern will soon get a breakout. The relative strength index (RSI) (14) continues to have a rising trendline and remains above 50, indicating that GLD has the strength to move higher. The moving average convergence/divergence (MACD) (12,26,9) has firmed up above the zero line. The stochastic (14,3,3) has also confirmed higher lows while turning bullish after a brief test of the median line at 50. Momentum is with the bulls when the stochastic is above 50. SYMMETRICAL TRIANGLE |
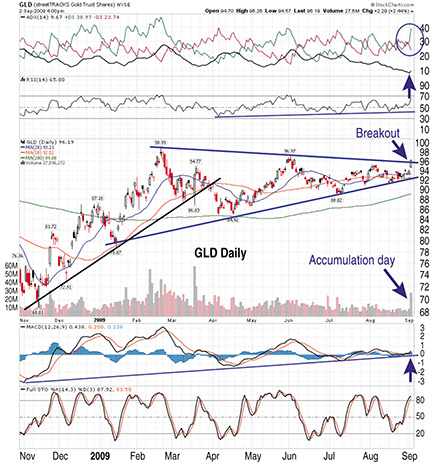 FIGURE 2: GLD, DAILY. The trend-based indicators in this chart represented by the ADX and the MACD are both confirming the breakout. The newly overbought stochastic reveals that momentum has shifted in favor of the bulls, while a strong increase in volume validates the price surge. |
| GLD has consolidated throughout 2009 in the form of a symmetrical triangle. This triangle is more than likely setting up a continuation pattern that may result in the rediscovery of the next vein in the gold sector. The symmetrical triangle broke on September 2, 2009, which should build the momentum necessary to push above the neckline on the inverse head & shoulders pattern in the weekly time frame. At that point, it will be next to impossible for the bears to do anything concrete to stop the bulls, as they cement more power. The symmetrical triangle pattern measures 20 points to a target of approximately $116. Remember, the target for the inverse head & shoulders pattern on the weekly chart is higher than that at $128. In the daily time frame, the indicators seem to be in sync with a bullish outcome as well. First of all, the breakout on the daily chart was confirmed by massive volume. The RSI has a nice rising trendline while moving to new highs. The MACD is also bouncing off a long-term trendline after turning bullish with the breakout, ready to sail back above the zero line. The stochastic has become newly overbought, showing that momentum is with the bulls. Parenthetically, the ADX on the daily chart is attempting to put in a bottom, similar to what we saw in the weekly time frame. The +DI line crossed above the -DI in a bullish fashion, coinciding with the breakout of the triangle pattern. The price, volume, and indicators are all blending together in a confluence of support centered around this breakout. WHERE WILL GOLD GO? As we begin to speculate on the next big advance in the gold ETF, we must not only have the right equipment (our indicators) but should also study the fault lines of support and resistance. The geologist in the Darby story knew that if the junk dealer drilled in the right place, he would rediscover the vein. Just as we know that if prices continue to drill into resistance on GLD's weekly chart and penetrate through it, we very well may only be three feet away from tapping into the next gold vein. |
Ron Walker is an active trader and technician. He operates an education website dedicated to the study of technical analysis. The website offers free market analysis with daily video presentations and commentaries. He may be reached through his website at thechartpattern.com or via thechartpattern@gmail.com.
| Website: | thechartpatterntrader.com |
| E-mail address: | thechartpatterntrader@gmail.com |
PRINT THIS ARTICLE

Request Information From Our Sponsors
- StockCharts.com, Inc.
- Candle Patterns
- Candlestick Charting Explained
- Intermarket Technical Analysis
- John Murphy on Chart Analysis
- John Murphy's Chart Pattern Recognition
- John Murphy's Market Message
- MurphyExplainsMarketAnalysis-Intermarket Analysis
- MurphyExplainsMarketAnalysis-Visual Analysis
- StockCharts.com
- Technical Analysis of the Financial Markets
- The Visual Investor
- VectorVest, Inc.
- Executive Premier Workshop
- One-Day Options Course
- OptionsPro
- Retirement Income Workshop
- Sure-Fire Trading Systems (VectorVest, Inc.)
- Trading as a Business Workshop
- VectorVest 7 EOD
- VectorVest 7 RealTime/IntraDay
- VectorVest AutoTester
- VectorVest Educational Services
- VectorVest OnLine
- VectorVest Options Analyzer
- VectorVest ProGraphics v6.0
- VectorVest ProTrader 7
- VectorVest RealTime Derby Tool
- VectorVest Simulator
- VectorVest Variator
- VectorVest Watchdog