HOT TOPICS LIST
- Strategies
- Stocks
- Buy
- Investing
- Brokers
- Psychology
- Interviews
- Accumulate
- Sell
- Hold
- Spotlight
- Websites
- Candlestick Corner
- Gold & Metals
- Options Trading
LIST OF TOPICS
TRADING DIARY
How I Won My Gold
11/20/09 01:51:31 PM PSTby Alexander Elder, MD
This is the first in a series of articles analyzing winning trades at SpikeTrade.com. SpikeTrade is a group of 20 professional and semiprofessional traders involved in a weekly competition. This time, we will review the winning trade for the week ended October 10, 2009. The trader is Sergey S., a full-time investment advisor from Toronto, Canada. Here are his comments at the conclusion of his trade.
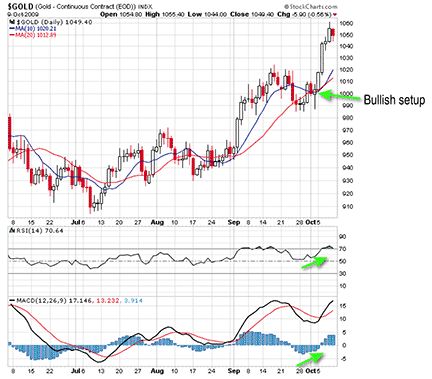
| Sergey wrote: Last week was one of my best in my trading career. The weakness in the US dollar and the bullish setup in gold were obvious, and I went long several gold miners: IAG, AEM, CDE, GOLD, and AUY. The result was a double-digit gain in my trading account. Every weekend I do my homework and analyze all financial markets: forex, bonds, commodities, and equities. Last weekend I saw that the US dollar and government bonds had bearish setups (Figure 1).
FIGURE 1: BEARISH SETUPS IN US DOLLAR AND GOVERNMENT BONDS But gold had a bullish setup. When I want to go long gold, I usually buy gold miners, because of the leverage effects (Figure 2).
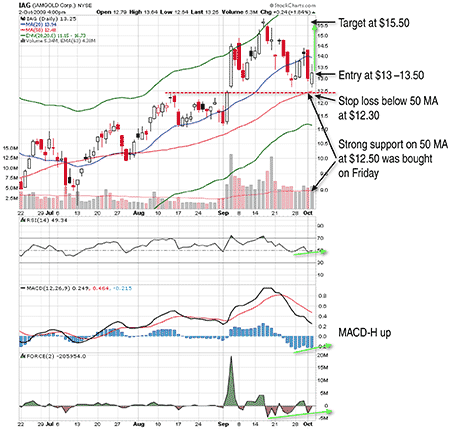
FIGURE 2: BULLISH SETUP IN GOLD IAMGOLD Corp. is a Canadian gold miner. IAG held very well at its support near the 50-day moving average (MA) at $12.50 (Figure 3). The weekly and daily impulse systems were blue, permitting buying. Both moving average convergence/divergence (MACD) histogram and the force index were trying to bounce. |
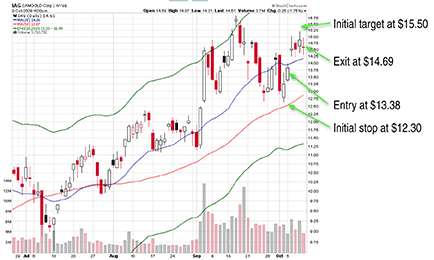
 FIGURE 3: ANALYZING GOLD MINING STOCKS My initial trading plan was to buy in the $13--13.50 area, with a stop at $12.30 and a target of $15.50 (Figure 4). This meant a 3.6:1 reward to risk ratio, a very attractive number.
FIGURE 4: THE TRADING PLAN I opened my position on Monday at $13.38, which turned out to be almost the low of the day. On Thursday, IAG almost reached my target, but I decided to raise it to $17. On Friday, I had a business meeting and could not monitor this position. I decided to use the daily pivot point as my stop level, and it was hit when the stock sagged to 14. TRADE REVIEW On weekends I review all Spike picks and select one stock to piggyback in the week ahead. On the weekend of Sergey's IAG pick, I was hugely bullish on gold and already held gold futures. A gold stock immediately drew my attention. The technical reasons why IAG appeared especially attractive are highlighted in Figure 5. |
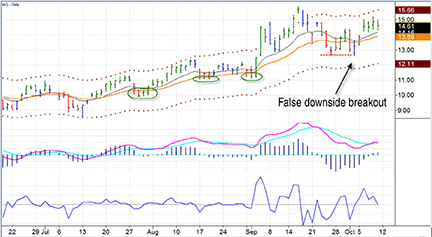
 FIGURE 5: REVIEW OF TRADE The chart showed a steady uptrend, but it also made it clear that every few weeks the bulls panicked and sold. All of those declines ended just below the stock's value zone, defined by two moving averages and marked by green ovals on the chart. Trading this kind of stock makes me think of going to a cash machine, because of its orderly swings from the undervalued zone below the moving averages to the overvalued zone in the vicinity of the upper channel line. Another bullish factor screamed to me from this chart: a false downside breakout on Friday prior to the weekend when the stock was picked. A week earlier, on Friday, September 25, IAG fell to a low of $12.67 before rebounding. On Friday, October 2, IAG fell three cents below that low to $12.64 and then rallied, closing well above the just-broken support line. This completed a false downside breakout -- one of the strongest signs in technical analysis. Amateurs love buying upside breakouts and shorting downside breakouts, but professionals know that most breakouts reverse. This is why we tend to fade them -- trade against them. We short upside breakouts and buy downside breakouts, betting against deviations and for a return to normalcy. |
| That IAG broke below its previous low by a few cents and then jumped, giving a sign that the tight stops on long positions have been cleaned out, but there was no follow-through to the downside. The market runs on a two-party system -- bulls and bears. The fact that bears could push prices down only momentarily but could not hold them there indicated that they were weak. When bears are weak, it is time to bet on the bulls. On Monday, IAG erupted in a rally, and by Friday, Sergey has earned his gold medal for the week. SpikeTrade rules call for closing trades before the weekend, which is exactly what Sergey did. Note that important market patterns are often symmetrical. Just as a false downside breakout gave a terrific buy signal, a false upside breakout signaled that the upswing was at its end, and it was a good time to take profits. On Thursday, October 8, IAG broke above its Tuesday high of 15.03 by 17 cents -- but could not hold that level and closed below the resistance line. The next day, the trade was over. In the next article we will review one of the SpikeTrade wining trades from November 2009. Let us see what lesson we can learn from it. |
| SUGGESTED READING Elder, Alexander [1993]. Trading For A Living, %A0%A0%A0John Wiley & Sons. _____ [2002]. Come Into My Trading Room, John Wiley & Sons. Murphy, John J. [1991]. Intermarket Technical Analysis, John Wiley & Sons. |
Alexander Elder is a professional trader based in New York City. He is the author of Come Into My Trading Room (Barron’s 2002 Book of the Year) and Trading For A Living, considered modern classics among traders. He also wrote Entries & Exits and Sell and Sell Short. He runs SpikeTrade.com with Kerry Lovvorn, a professional trader from Alabama. He may be reached at info@spiketrade.com.
PRINT THIS ARTICLE

Request Information From Our Sponsors
- StockCharts.com, Inc.
- Candle Patterns
- Candlestick Charting Explained
- Intermarket Technical Analysis
- John Murphy on Chart Analysis
- John Murphy's Chart Pattern Recognition
- John Murphy's Market Message
- MurphyExplainsMarketAnalysis-Intermarket Analysis
- MurphyExplainsMarketAnalysis-Visual Analysis
- StockCharts.com
- Technical Analysis of the Financial Markets
- The Visual Investor
- VectorVest, Inc.
- Executive Premier Workshop
- One-Day Options Course
- OptionsPro
- Retirement Income Workshop
- Sure-Fire Trading Systems (VectorVest, Inc.)
- Trading as a Business Workshop
- VectorVest 7 EOD
- VectorVest 7 RealTime/IntraDay
- VectorVest AutoTester
- VectorVest Educational Services
- VectorVest OnLine
- VectorVest Options Analyzer
- VectorVest ProGraphics v6.0
- VectorVest ProTrader 7
- VectorVest RealTime Derby Tool
- VectorVest Simulator
- VectorVest Variator
- VectorVest Watchdog


