HOT TOPICS LIST
- Strategies
- Stocks
- Buy
- Investing
- Brokers
- Psychology
- Interviews
- Accumulate
- Sell
- Hold
- Spotlight
- Websites
- Candlestick Corner
- Gold & Metals
- Options Trading
LIST OF TOPICS
TRADER'S NOTEBOOK
A Gem In The Junk Pile
01/22/10 03:55:48 PM PSTby Alexander Elder, MD
SpikeTrade.com is a group of 20 professional and semiprofessional traders involved in a weekly competition. Each member submits his or her pick along with the entry, target, and stop. The picks are submitted in solitude, and then all are revealed on Sunday afternoon. At the end of each week, the Spiker who wins that week’s competition writes up his or her analysis of the trade.
| In this article, I will review the winning trade from the week ended December 31, 2009. The trader is Stephen M., a dedicated semiprofessional trader, who has become one of the top-performing members of the Spike group. Here is his analysis of his latest winning trade: |
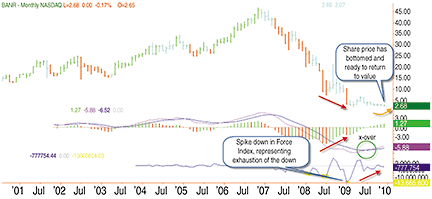
| Regional banks are among the few values left in this bloated market. After reviewing what happened in the last week of 2008, I discovered that much of the buying went to the extremely undervalued bottom-dwellers. So as of this week (December 31, 2009), I dredged the bottom to find Banner Corp. (BANR) in the savings & loan banking sector). The firm recently withdrew its announcement of a secondary offering due to an upbeat guidance and renewed confidence in its ability to be profitable without the offering. This news lifted the stock off the bottom on huge volume during the week prior to the trade. It traced a bullish engulfing bar on the weekly chart. The monthly chart (Figure 1) clearly shows the stock dropping hard on extreme volume, retesting the low, and then flat-lining with each bar getting smaller and smaller while bearishness dried up. Based on the news, the extreme oversold condition, the increasing bullishness of the indicators, and on the volume surge on Friday, I decided that this stock had enough positive inertia for a nice gain as the year closed out.
FIGURE 1: BANR, MONTHLY. The stock is dropping hard on extreme volume, then retesting the low and then flat-lining with each bar getting smaller and smaller while bearishness dried up.
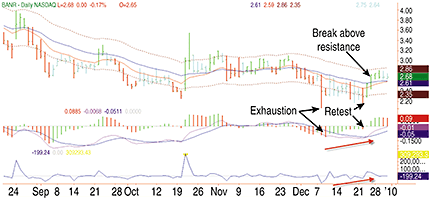
The daily chart (Figure 2) shows a hard selloff in July 2009, followed by a sideways move and then a drop to a new low that was rejected earlier this month. Since then, BANR has recovered to rise above both its fast and slow exponential moving averages (EMAs) and touching the EMA50. This recent rally has also caused the force index to break out above its downtrend line.
FIGURE 2: BANR, DAILY. There was a hard selloff in July followed by a sideways move and then a drop to a new low that was rejected earlier this month. |
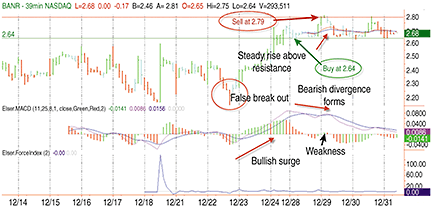
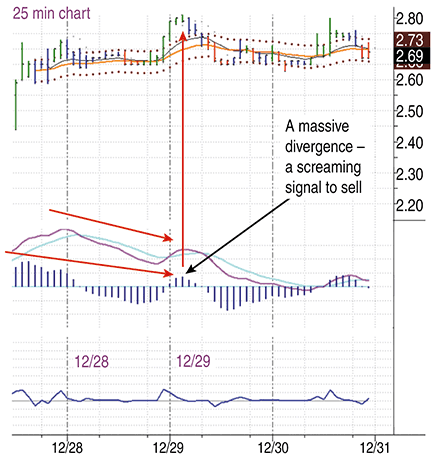
| My objective was to pick up the stock at 2.62, which was its breakout level. After the market opened on Monday, the stock immediately moved above its previous day’s high of 2.72 and pulled back. I picked it up at the low of the day and decided to hold it overnight due to its surge late in the day. On Tuesday, the market looked weak, so I sold after the stock took out its Monday high. A bearish divergence formed on the 39-minute chart (Figure 3), which suggested little chance of a further upmove that day. So I sold at 2.79. But it turned out that the stock had a little more energy left, taking it to a weekly high of 2.81.
FIGURE 3: 39-MINUTE. The bearish divergence suggested little chance of a further upmove. When I was entering this trade, I had hoped for a big squeeze to ignite a rally, as the short interest ratio was 24 and 37% of the float was short. The market didn’t offer much, but I was happy to take what it gave in light of the unpredictability of year-end action and light volume. I’m looking forward to trading in 2010, as the market is signaling curves ahead. No doubt this will challenge our discipline and ability to embrace new strategies to exploit the challenges. TRADE REVIEW
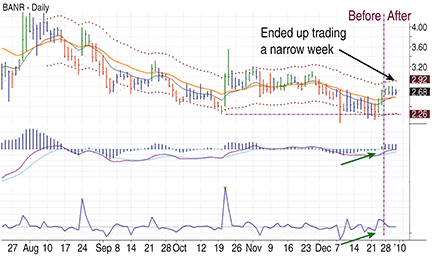
FIGURE 4: MULTILEVEL ANALYSIS AND FLEXIBILITY. Looking at this chart, you could be expected an explosive move out of a tight squeeze but end up facing something else. |
| Steve decided to buy BANR on the basis of several factors: fundamental (one of the few remaining values), technical (a bullish engulfing bar), and historical (the previous December’s action). This is typical of successful traders who know that markets are complex and rarely move in response to a single factor. A beginner typically falls in love with a single indicator and looks for its pattern on every chart; professionals tend to use multilevel analysis. Another key trait of successful traders is flexibility, and Steve’s diary clearly illustrates the importance of that skill. He was expecting an explosive move out of a tight squeeze — but ended up facing one of the narrowest weeks of the year (Figure 5).
FIGURE 5: MY WAY OR THE HIGHWAY. If you have the discipline you can survive an unexpected turn of events. Here, even though you had the opportunity to enter, at the slightest sign of a reversal, the trader sold his position and content with a small gain. He survived this unexpected turn of events, thanks to his discipline. When BANR jumped out of the gate and it appeared that the anticipated explosion had begun, Steve refused to chase the stock. He was perfectly willing to give up a trade unless he could enter it on his own terms. I refer to this attitude as “My way or the highway.” When the stock did give him an opportunity to enter, he bought it but immediately changed his game plan. When a rocket appears to sink back to its launching pad, it brings the entire launch into question. At this point, Steve was no longer holding out for a massive explosion. He lowered his sights and began watching for the most minuscule signs of a reversal. He sold a short-term bearish divergence, content with a small gain. A beginner greedily holds out for the big bird in the bush, but Steve happily settled for a much smaller one in hand — and ended with the best Spike trade of that week. Next time, I will review one of the winning trades from January 2010. Let’s see what we can learn from it. |
| SUGGESTED READING Elder, Alexander [2010]. “How I Won My Gold,” Technical Analysis of STOCKS & COMMODITIES, Volume 28: January. _____ [2006]. Entries & Exits: Visits To 16 Trading Rooms, John Wiley & Sons. |
Alexander Elder is a professional trader based in New York City. He is the author of Come Into My Trading Room (Barron’s 2002 Book of the Year) and Trading For A Living, considered modern classics among traders. He also wrote Entries & Exits and Sell and Sell Short. He runs SpikeTrade.com with Kerry Lovvorn, a professional trader from Alabama. He may be reached at info@spiketrade.com.
PRINT THIS ARTICLE

Request Information From Our Sponsors
- StockCharts.com, Inc.
- Candle Patterns
- Candlestick Charting Explained
- Intermarket Technical Analysis
- John Murphy on Chart Analysis
- John Murphy's Chart Pattern Recognition
- John Murphy's Market Message
- MurphyExplainsMarketAnalysis-Intermarket Analysis
- MurphyExplainsMarketAnalysis-Visual Analysis
- StockCharts.com
- Technical Analysis of the Financial Markets
- The Visual Investor
- VectorVest, Inc.
- Executive Premier Workshop
- One-Day Options Course
- OptionsPro
- Retirement Income Workshop
- Sure-Fire Trading Systems (VectorVest, Inc.)
- Trading as a Business Workshop
- VectorVest 7 EOD
- VectorVest 7 RealTime/IntraDay
- VectorVest AutoTester
- VectorVest Educational Services
- VectorVest OnLine
- VectorVest Options Analyzer
- VectorVest ProGraphics v6.0
- VectorVest ProTrader 7
- VectorVest RealTime Derby Tool
- VectorVest Simulator
- VectorVest Variator
- VectorVest Watchdog

