HOT TOPICS LIST
- Strategies
- Stocks
- Buy
- Investing
- Brokers
- Psychology
- Interviews
- Accumulate
- Sell
- Hold
- Spotlight
- Websites
- Candlestick Corner
- Gold & Metals
- Options Trading
LIST OF TOPICS
THE CHARTIST
Is Trading That Simple?
05/03/10 10:46:40 AM PSTby Dan Zanger and Matt Blackman
Like many traders, I first learned of Dan Zanger in a December 2000 Forbes article entitled "My stocks are up 10,000 percent!" that described how the former swimming pool contractor made stock market history by parlaying $10,775 into $18 million in 18 months. What the story didn't include was how he subsequently grew this nest egg to more than $42 million in a total of 24 months. But it took him years of hard knocks and experience to get there.
Since I interviewed Dan Zanger for STOCKS & COMMODITIES, I have had the privilege of watching him trade in real time. He walks the walk and has the track record to back it up. Markets are his primary passion and, based on his continued success, they remain a gold-paved two-way street. Here, Zanger provides some clues on how the charts "speak to him" to help him decipher what is really going on. --Matt Blackman
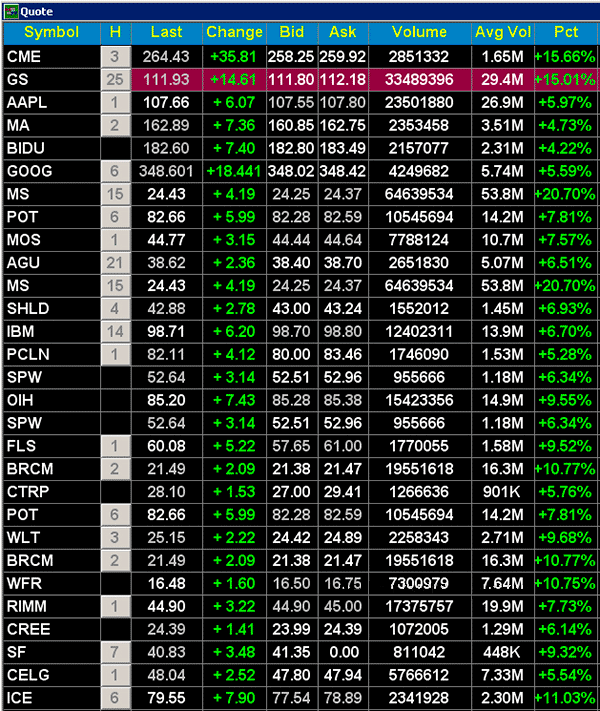
| WHITHER THE MARKET? Dan Zanger says: One of the questions I am asked most frequently is where the market is headed. As seasoned traders learn, predictions rely on a number of assumptions and if just one assumption is wrong, the whole game comes undone. Trying to predict market direction, especially for more than a day or two, is a sucker's game. But that doesn't mean that the charts don't leave clues about where a stock may be headed in the short term. Stocks bottomed during the week of March 9, 2009, but as anyone who traded during that period can tell you, it was not that clear at the time. Here are some charts with notes showing some of the powerful clues that a trend change was unfolding. Figure 1 shows my quote screen from March 30, 2009, showing some of the market-leading stocks I was following at the time. Note that many were making powerful moves on much higher than average volume -- a dead giveaway that a rally was gaining momentum.
FIGURE 1: MARKET LEADERS. Here is how the market leaders were performing on March 30, 2009. You can see some big moves on massive volume. |
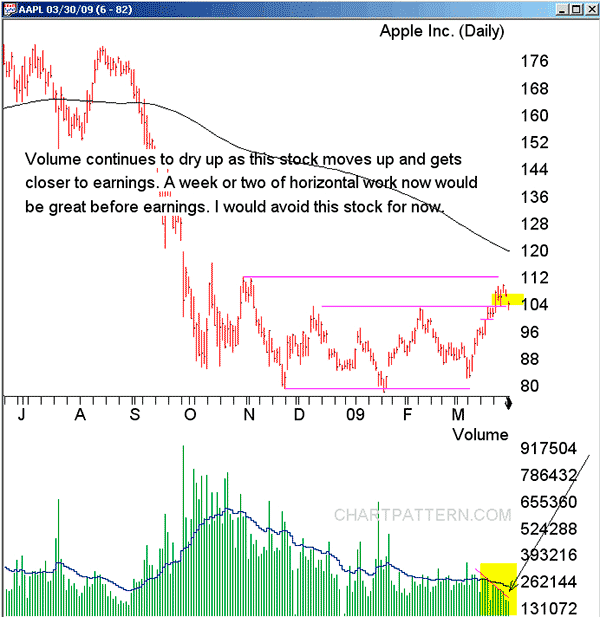
| CHARTS SPEAK VOLUMES Before any sustainable rally can begin, the weak hands must be shaken out to allow the strong players like hedge funds and institutions to take over. Figure 2 of Apple Inc. (AAPL) shows a triple bottom, during which time selling volume dries up as the bears are unable to take the stock to new lows. AAPL first hit bottom in mid-November 2008, then put a second bottom in mid-January 2009 and a third bottom in March 2009, which was higher than the January low. Note that volume declined during this entire period.
FIGURE 2: A CLASSIC BOTTOMING PROCESS. As one of the market leaders, AAPL was among the early stocks to bottom and begin to put in higher lows and higher highs.
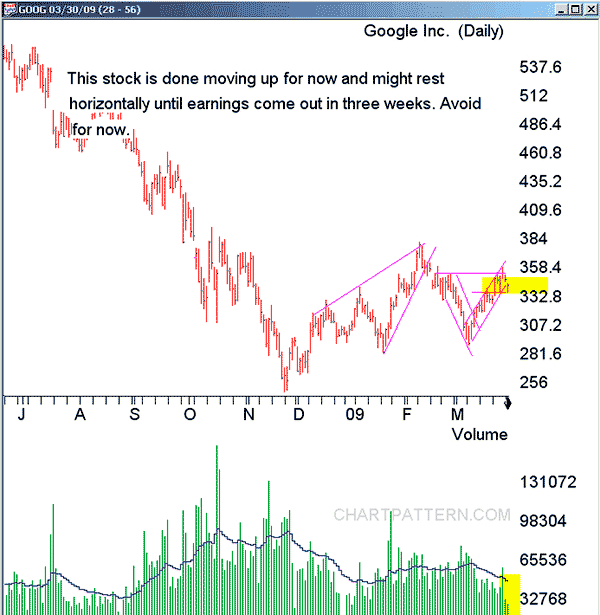
What other patterns do you see in the next chart? Remember that volume provides valuable clues. Triple tops and bottoms, head & shoulders tops and bottoms and rounding saucer patterns are relatively rare chart patterns. More common are bear and bull flag patterns. In the chart of Google Inc. (GOOG) in Figure 3 we see an example of both highlighted as well as two potential V-bottoms. Can you pick out the rough head & shoulders bottom here as well? In addition, note that through this chart, volume dries up and GOOG starts to push higher. That is a good sign that sellers are running out of stock to dump and the smart hands are accumulating.
FIGURE 3: MORE BOTTOMING PATTERNS. On this daily chart of GOOG, because of declining volume on up moves, most market players are waiting. But someone is buying! |
| CHARTING READING 101 Chart patterns are easy to pick out once someone has pointed them out to you; the trick is that it takes years of practice and application to see them for yourself in a rapidly moving market in real time. But like any skill, it is one that can be mastered with the necessary education and tools along with a healthy dose of commitment and dedication. It is as simple as learning to read the clues that price and volume leave behind. Like any great skill, it may be simple but it's not easy. The good news is that the benefits can be extremely rewarding for those who get it right. SUGGESTED READING |
Dan Zanger gained media attention thanks to a December 2000 Fortune magazine article titled "My stocks are up 10,000 percent!" It described his "overnight" success in turning an ante of $10,775 into $18 million in 18 months. He is the host of Chartpattern.com and author of the daily "The Zanger Report" stock trading newsletter.
Matt Blackman is a full-time technical and financial writer and trader. He produces corporate and financial newsletters, and assists clients in getting published in the mainstream media. He is the host of TradeSystemGuru.com. Matt is a member of the Canadian Society of Technical Analysts. He can be reached at indextradermb@gmail.com. Find out what stocks and futures Matt is watching on Twitter at http://www.twitter.com/MattBlackmanCMT
PRINT THIS ARTICLE

Request Information From Our Sponsors
- VectorVest, Inc.
- Executive Premier Workshop
- One-Day Options Course
- OptionsPro
- Retirement Income Workshop
- Sure-Fire Trading Systems (VectorVest, Inc.)
- Trading as a Business Workshop
- VectorVest 7 EOD
- VectorVest 7 RealTime/IntraDay
- VectorVest AutoTester
- VectorVest Educational Services
- VectorVest OnLine
- VectorVest Options Analyzer
- VectorVest ProGraphics v6.0
- VectorVest ProTrader 7
- VectorVest RealTime Derby Tool
- VectorVest Simulator
- VectorVest Variator
- VectorVest Watchdog
- StockCharts.com, Inc.
- Candle Patterns
- Candlestick Charting Explained
- Intermarket Technical Analysis
- John Murphy on Chart Analysis
- John Murphy's Chart Pattern Recognition
- John Murphy's Market Message
- MurphyExplainsMarketAnalysis-Intermarket Analysis
- MurphyExplainsMarketAnalysis-Visual Analysis
- StockCharts.com
- Technical Analysis of the Financial Markets
- The Visual Investor


