HOT TOPICS LIST
- Strategies
- Stocks
- Buy
- Investing
- Brokers
- Psychology
- Interviews
- Accumulate
- Sell
- Hold
- Spotlight
- Websites
- Candlestick Corner
- Gold & Metals
- Options Trading
LIST OF TOPICS
TRADER'S NOTEBOOK
Price And Volume Disconnect
08/27/10 10:39:50 AM PSTby L.A. Little
If prices are moving higher and higher, why are they doing so on less and less volume?
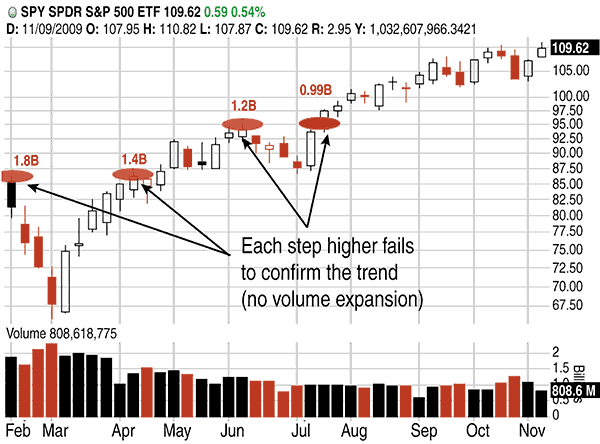
| Technical analysis tends to consider price, volume, and time as its main components. Trend has always been viewed as a derivative of price, although some technicians, including me, utilize volume as part of trend definition as well (see "Definitions", below). What has become a regular feature of the market for the past year is that prices move higher and higher on less and less volume. How can this be? HIGHER PRICES, LESS VOLUME
FIGURE 1: HIGHER PRICES, LESS VOLUME. Since April 2009, volume has failed to confirm the trend, yet the market continues to march higher.
How can prices move higher with less volume? Logically, when you think of higher prices, you think of a greater number of buyers than sellers. But that is not the same thing as an expanding number of buyers. This very important concept is at the heart of what we are seeing today. It is a warning sign and is a direct consequence of suspect trends. PRICE CAN MOVE HIGHER WITH FEWER BUYERS
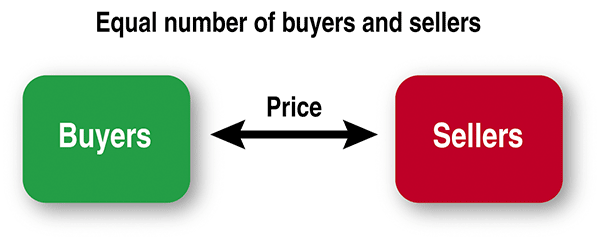
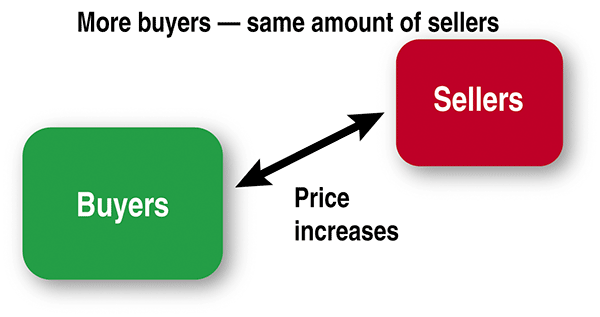
FIGURE 2: EQUAL AMOUNT OF BUYERS AND SELLERS. When there are an equal number of buyers versus sellers, price is approximately equal: It doesn’t move up or down. Normally, when you see prices increase you picture the marketplace to be like what is represented in Figure 3.
FIGURE 3: MORE BUYERS, SAME NUMBER OF SELLERS. Typically, when there are more buyers, you expect prices to increase. |
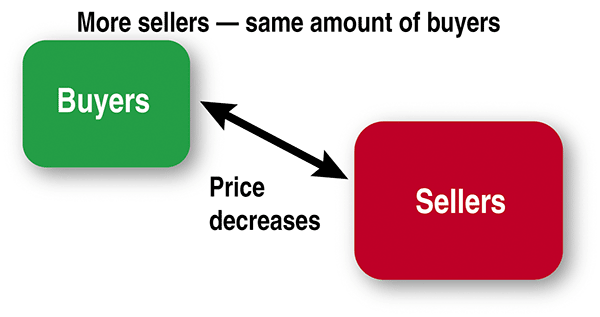
| If prices decrease, you picture the marketplace in a like fashion, just in the opposite manner (Figure 4). Over longer periods of time this is what typically happens: Buyers expand when prices move higher and sellers expand when prices move lower. There is, however, another explanation as to why prices rise, one that most market participants do not consider.
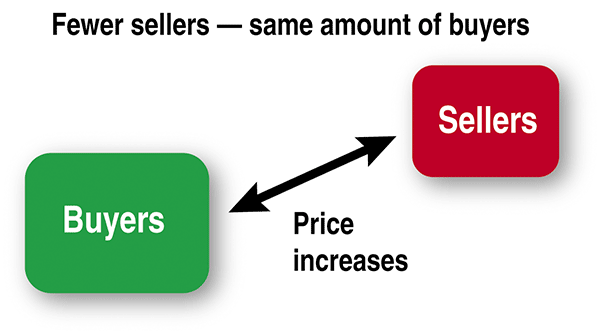
FIGURE 4: MORE SELLERS, SAME NUMBER OF BUYERS. If there are more sellers, then you expect prices to decrease. Consider the graph in Figure 5. Here you can see that it is quite possible for prices to move higher with the same number of buyers — you just need there to be fewer sellers.
FIGURE 5: FEWER SELLERS, SAME NUMBER OF BUYERS. It is possible for prices to move higher with the same number of buyers. There just needs to be fewer sellers.
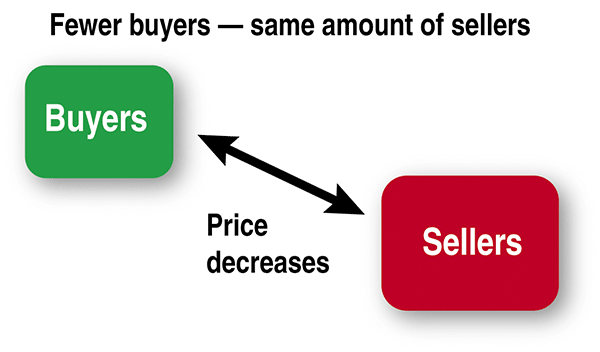
And that is what we have witnessed since April 2009. What we are witnessing in the marketplace is not an equal number of buyers, but a shrinking pool of buyers. Prices still rise, though, because the number of sellers has shrunk at a faster pace. For the sake of completeness, Figure 6 shows the alternate case where prices decline. As you can see, it’s not because there are more sellers — again, it’s because there are fewer buyers.
FIGURE 6: FEWER BUYERS, SAME NUMBER OF SELLERS. When prices decline, it’s not because there are more sellers — just fewer buyers. CONSEQUENCES OF A SUSPECT PRICE ADVANCE The same is true of a downtrend where volume does not expand. In that case, you have the same number of sellers (or possibly less) but even fewer buyers. Once you realize that the market is printing higher prices without volume confirmation, then you truly are at greater risk of the trend reversing and doing so both quickly and violently. The same is true of a downtrend. It doesn’t provide you with a timetable as to when it will occur, just that it almost certainly will. If you understand this is a real possibility, then you can take precautions. |
| In the case of SPY, this uptrend is suspect and has been since April 2009. When it finally corrects, it will be a long trip back whence it came. With the Federal Reserve holding interest rates at zero percent in order to recapitalize the banks, it could take even longer for this to play out, although there continue to be equity price distress signals in 2010. Whatever the case, it’s important to realize what is driving this activity. Knowledge is an asset. Eventually, interest rates will rise and when they do, this "bail out the banks" policy and suspect advance will meet their demise. You should have your plan ready for when that day comes. SUGGESTED READING |
| GLOSSARY Anchors - An anchor is a price bar where volume for the bar, when compared to volume for all other bars on the examined time frame, is significantly noticeable. Anchor Top - The high price of an anchor bar. Anchor Bottom - The low price of an anchor bar. Actualized Swing Point - When a potential swing point low remains the low price point for more than six consecutive bars, then the swing point low becomes actualized. The same is true of a potential swing point high. When a potential swing point high remains the high price point for more than six consecutive bars, then the swing point high becomes actualized. Channels - Channels are technical patterns where a line is drawn across the tops and bottoms of multiple bars. The top and bottom lines are equally spaced and directionally can be up, down, or horizontal in their slope. Confirmed Trend - When the current price trades lower (down trend) or higher (up trend) than the previous swing point price and volume expands, the trend is suspect. Confirmed Bearish Trend - As part of the same directional move, a series of lower price highs and lower price lows (not necessarily sequential) where price trades below and closes lower than the most recent previous swing point low while volume expands as compared to volume at the previous swing point low. Confirmed Bullish Trend - As part of the same directional move, a series of higher price highs and higher price lows (not necessarily sequential) where price trades above, and closes higher than the most recent previous swing point high while volume expands as compared to volume at the previous swing point high. Confirmed Sideways Trend - The interruption of a bullish (or bearish) trend where sequential swing points interrupt the existing trend of higher highs and higher lows or lower highs and lower lows while volume expands on that interruption. Gap - A gap is an area of the chart where prices simply do not trade. This could be on any time frame but the shorter the time frame the greater the potential for price gaps to exist. Potential Swing Point - The identification of a swing point begins with a potential swing point. A potential swing point is any chart bar where a high or low was established as compared to the preceding bar. If the high of the current bar is higher than the preceding bar, then the currently examined bar has the potential to be a swing point high. Conversely, if the low is lower that the previous bar, then it has the potential to be a swing point low. Price Magnets - Price magnets are high volume bars found at the top or the bottom of a chart on a given time frame. Price Projections - Price projections are derived from trading signals providing the opportunity to assign a target price to an expected move higher or lower. Price Reversals - A price reversal is, as it sounds, a place on the chart where a directional move reverses and begins to trade in the opposite direction. Resistance - Resistance is an area of the chart where, for whatever reason, the expectations is for higher prices to be resisted. Suspect Trend - When the current price trades lower (down trend) or higher (up trend) than the previous swing point price and volume contracts, the trend is suspect. Suspect Bearish Trend - As part of the same directional move, a series of lower price highs and lower price lows (not necessarily sequential) where price trades below and closes lower than the most recent previous swing point low while volume contracts as compared to volume at the previous swing point low. Suspect Bullish Trend - As part of the same directional move, a series of higher price highs and higher price lows (not necessarily sequential) where price trades above, and closes higher than the most recent previous swing point high while volume contracts as compared to volume at the previous swing point high. Suspect Sideways Trend - The interruption of a bullish (or bearish) trend where sequential swing points interrupt the existing trend of higher highs and higher lows or lower highs and lower lows while volume contracts on that interruption. Support - Support is an area on the chart where, for whatever reason, the expectation is that current prices will be supported. Swing Point High - Throughout the book, the notation SPH is used to signify a swing point high. Swing point high is a common term used to signify a high bar on a chart where prices once traded to but turned away from and have yet to revisit. Swing Point Low - Throughout the book, the notation SPL is used to signify a swing point low. Swing point low is a common term used to signify a low bar on a chart where prices once traded to but turned away from and have yet to revisit. Time Frames - Time frames are arbitrarily chosen time slices on a chart. Trend Line - A trend line is a charting technique where a technician applies a line to a chart in order to represent the trend in a given security. The act of drawing a trendline is as simple as drawing a straight line that follows a general trend. Trend lines are used as a visual aid to highlight an underlying trend. Zones - A zone is a price area on the chart where prices should trade to and have difficulty trading beyond. It isn’t a single price point but instead a price range and is typically associated with support and resistance. |
L.A. Little is an author, professional trader, and money manager who writes for www.tatoday.com.
PRINT THIS ARTICLE

Request Information From Our Sponsors
- StockCharts.com, Inc.
- Candle Patterns
- Candlestick Charting Explained
- Intermarket Technical Analysis
- John Murphy on Chart Analysis
- John Murphy's Chart Pattern Recognition
- John Murphy's Market Message
- MurphyExplainsMarketAnalysis-Intermarket Analysis
- MurphyExplainsMarketAnalysis-Visual Analysis
- StockCharts.com
- Technical Analysis of the Financial Markets
- The Visual Investor
- VectorVest, Inc.
- Executive Premier Workshop
- One-Day Options Course
- OptionsPro
- Retirement Income Workshop
- Sure-Fire Trading Systems (VectorVest, Inc.)
- Trading as a Business Workshop
- VectorVest 7 EOD
- VectorVest 7 RealTime/IntraDay
- VectorVest AutoTester
- VectorVest Educational Services
- VectorVest OnLine
- VectorVest Options Analyzer
- VectorVest ProGraphics v6.0
- VectorVest ProTrader 7
- VectorVest RealTime Derby Tool
- VectorVest Simulator
- VectorVest Variator
- VectorVest Watchdog

