HOT TOPICS LIST
- Strategies
- Stocks
- Buy
- Investing
- Brokers
- Psychology
- Interviews
- Accumulate
- Sell
- Hold
- Spotlight
- Websites
- Candlestick Corner
- Gold & Metals
- Options Trading
LIST OF TOPICS
TRADER'S NOTEBOOK
The Contrarian Put/Call Ratio
09/01/10 11:49:34 AM PSTby Ron Walker
A trader who thinks outside the box can bet against the crowds when they become irrational, and the put/call ratio can tell you how.
| The put/call ratio is considered a contrarian indicator. If option traders are bullish, call volume will exceed put volume and the put/call ratio will fall. If option traders are bearish, put volume will increase and the put/call ratio will rise. Deciphering the information on the put/call ratio will give a trader an extra advantage in determining market direction. The CBOE option equities put/call ratio ($CPCE) has a high success rate of forecasting major market turns. This ratio helps traders determine when greed and fear become so prevalent that they are unsustainable. Two types of options can be purchased: puts or calls. By purchasing a call option, the buyer is anticipating that the underlying security or index will rise. Conversely, the buyer of a put is betting that the security or index will fall. Each day, the Chicago Board Options Exchange (CBOE) adds together all of the call and put options that are traded on all individual equities in order to calculate the option equities put/call ratio ($CPCE). The ratio is calculated by dividing the number of traded put option contracts by the number of traded call option contracts. Here’s how the put/call ratio is expressed:
THE CONTRARIAN INDICATOR
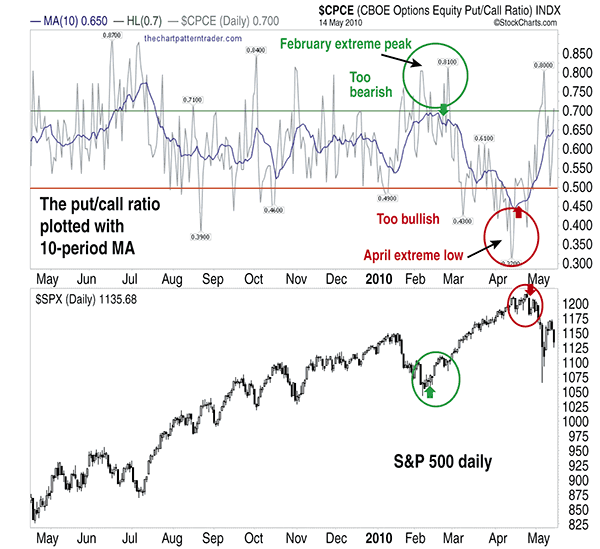
FIGURE 1: $CPCE DAILY, $SPX DAILY. Extreme peaks and lows on the put/call ratio marked turning points at the February low and the April high on the S&P 500. The 10-period moving average smoothes out the raw data, marking timely spots when the stock market was transitioning from an uptrend to a downtrend and vice versa. |
| In Figure 1, the put/call ratio is plotted as a line. Here we see that extreme peaks are currently forming above 0.80, while extreme lows are established below 0.50. The market lows in February corresponded with the extreme peak on the put/call ratio. The extreme spike low on the put/call ratio made in April 2010 warned of a market top. The extremes made in February occurred because option traders were overdosing on puts when they should have been purchasing calls. The extreme low made in late April revealed that option traders were looking at the market through rose-colored glasses. Highs on the put/call ratio mark areas where capitulation often occurs, while extreme lows help spot levels of complacency. This contrarian approach is very effective because historically, option traders are very emotional and have a low success rate. Shortly after the ratio bottomed in late April, it began to increase. That rise can be interpreted to mean that investors are starting to put their money back into put options rather than call options as they speculate that the market will move lower. Often, after a significant rise in the market, the ratio bottoms and then starts rising again as investors begin to hedge their portfolios in case of a selloff. CROWD BEHAVIOR It is at this point where independent-minded traders can take a contrarian approach to the crowds, which always behave irrationally when the pendulum swings too far in one direction. Crowds have the numbers to create a trend, but a trader who thinks outside the box can bet against the crowds when they become irrational. |
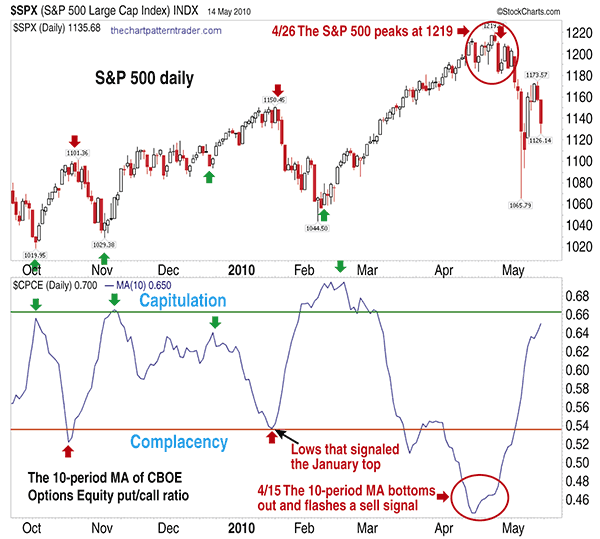
| SMOOTHING THE PUT/CALL RATIO The put/call line can be very erratic, with moves that show inconsistency. That is why many traders will plot a 10-day moving average (MA) alongside the ratio. This helps smooth out the raw data, making it easier to read the signals given by this indicator. Figure 2 displays the 10-day MA of the put/call ratio in the lower window. Above that is the daily chart of the Standard & Poor’s 500 (upper window).
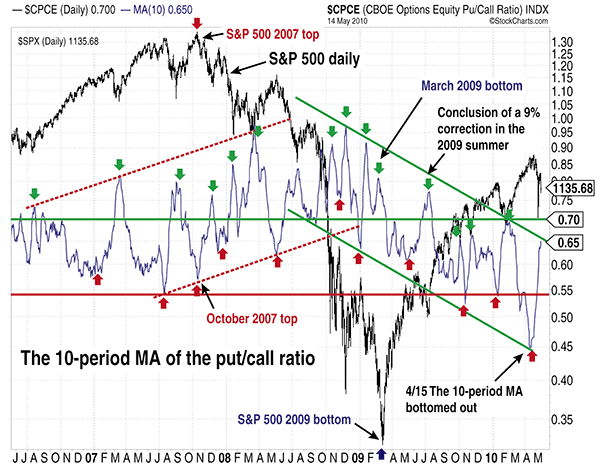
FIGURE 2: $SPX DAILY, $CPCE DAILY. The 10-period MA of the put/call ratio usually turns before the market does, forewarning traders of an impending reversal. By monitoring the put/call ratio, we can determine the amount of bullish or bearish sentiment. Low readings mark overbought conditions and levels of complacency. High readings mark oversold conditions and levels of capitulation. The put/call ratio is designed to gauge the overall mood of the market. The 10-day MA of the put/call ratio seeks to gauge the prevailing bullish or bearish sentiment in the market. Figure 2 shows that the 10-day MA made extreme lows in April, well below the lows that signaled the January top. Note how each of the red and green arrows correspond with a turning point on the S&P 500. The 10-period MA of the put/call ratio has a tendency to turn before or with the market. This can be seen with the most recent turn that was made in April. The 10-day MA turned back up after hitting multiyear lows on April 15, 2010, eight sessions prior to the peak that formed on the S&P 500 on April 26 (Figure 2). Shortly after the 10-period moving average bottomed out in April 2010 and began to rise, the S&P 500 peaked, signaling the start of a new downtrend. Figure 3 showcases the 10-period MA of the put/call ratio plotted behind the S&P 500 daily chart. The first basic observation is that the 10-period MA has formed channel lines during both declining and advancing markets. The extreme readings made in late 2008 and early 2009 formed the boundaries of a new falling channel.
FIGURE 3: $CPCE DAILY, $SPX DAILY. The 10-period MA of the put/call ratio began to move in a falling price channel just prior to its bottom in March 2009. A breakout from the channel may begin a new uptrend, suggesting a major correction in the stock market. The green and red arrowheads mark the turning points in the market, which traders can take advantage of for short-term trading purposes. |
| Once the S&P 500 bottomed in early 2009, the 10-period MA of the put/call ratio began a series of lower highs and lower lows to define the channel lines. As the market rose throughout 2009–10, the 10-period MA continued in a falling channel. Each time the 10-period MA bounced near its lower boundary line, it wasn’t too long afterward that the S&P 500 provided a correction. You can compare market turns on the S&P 500 with the peaks and troughs on the 10-period MA of the put/call ratio. The green and red arrowheads in Figure 3 mark the turning points in the market, which traders can take advantage of for short-term trading purposes. This contrarian indicator is not perfect, but it offers a trader a few moments in time to profitably exploit short-term moves in the S&P 500. Bottoms form when a low appears near the lower channel line (bottom green line in Figure 3), then turns back up and begins to rise. This flashes a signal for speculators to short the market or sell calls and buy puts. In contrast, if you look at the top resistance line of the falling channel (top green line in Figure 3), you will note that when the 10-period MA bounced off this trendline, it produced profitable buy signals for speculators. Going long after the 10-period MA peaks and going short after it bottoms can be a very profitable strategy. Should the falling channel of the 10-period MA of the put/call ratio break above the upper boundary of the channel, it may hint that a major market shift in trend direction is ready to transpire. A breakout from the channel may begin a new uptrend, suggesting a major correction in the stock market. |
| SUGGESTED READING Walker, Ron [2010]. "Intraday Short-Term Trading Tactics," Technical Analysis of STOCKS & COMMODITIES, Volume 28: March. |
Ron Walker is an active trader and technician. He operates an education website dedicated to the study of technical analysis. The website offers free market analysis with daily video presentations and commentaries. He may be reached through his website at thechartpattern.com or via thechartpattern@gmail.com.
| Website: | thechartpatterntrader.com |
| E-mail address: | thechartpatterntrader@gmail.com |
PRINT THIS ARTICLE

Request Information From Our Sponsors
- StockCharts.com, Inc.
- Candle Patterns
- Candlestick Charting Explained
- Intermarket Technical Analysis
- John Murphy on Chart Analysis
- John Murphy's Chart Pattern Recognition
- John Murphy's Market Message
- MurphyExplainsMarketAnalysis-Intermarket Analysis
- MurphyExplainsMarketAnalysis-Visual Analysis
- StockCharts.com
- Technical Analysis of the Financial Markets
- The Visual Investor
- VectorVest, Inc.
- Executive Premier Workshop
- One-Day Options Course
- OptionsPro
- Retirement Income Workshop
- Sure-Fire Trading Systems (VectorVest, Inc.)
- Trading as a Business Workshop
- VectorVest 7 EOD
- VectorVest 7 RealTime/IntraDay
- VectorVest AutoTester
- VectorVest Educational Services
- VectorVest OnLine
- VectorVest Options Analyzer
- VectorVest ProGraphics v6.0
- VectorVest ProTrader 7
- VectorVest RealTime Derby Tool
- VectorVest Simulator
- VectorVest Variator
- VectorVest Watchdog


