HOT TOPICS LIST
- Strategies
- Stocks
- Buy
- Investing
- Brokers
- Psychology
- Interviews
- Accumulate
- Sell
- Hold
- Spotlight
- Websites
- Candlestick Corner
- Gold & Metals
- Options Trading
LIST OF TOPICS
INVESTING
Dividends And Premiums, Oh My!
10/04/10 02:44:24 PM PSTby Teresa Fernandez
Plan carefully and you'll be surprised at how much you can reap only using Bollinger Bands and Excel.
| In this era of volatile markets and pessimistic investors, we need to do something different to stay ahead. No matter what anyone says, no matter what's happening, there is nothing sure in these markets -- except time. So why not use the passage of time to our advantage? We need to hold our stocks to collect dividends, and we need to let time pass to allow those covered calls to expire worthless. |
| CAPITAL GAINS OR DIVIDENDS? As a rule, people buy stock for one of two reasons: capital gains or dividend yield. A stock like Apple (AAPL), a company that has mountains of backorders for its iPad and the latest generation of its iPhone, is expected to explode in price once this bull market gets going. Since its products appeal to all generations, currently we accept that the company does not pay dividends. But when the market crashes, the way it did in May 2009, stocks that do not pay dividends like AAPL and Google (GOOG) suffer the most. With no dividends, these stocks are the first ones that mutual funds dump when the market makes their managers uncomfortable. GOOG dropped from $595 last April to $481 when the Dow Jones Industrial Average (DJIA) was at 9700, a drop of nearly 20% in six weeks. On the other hand, a stock like Altria (MO), like others in mature industries, is not expected to move much, regardless of what the market is doing. When the DJIA was at its recovery high of 11206 last April 26, MO was at $21.44. When the DJIA was at its recent low of 9726 on June 8, MO was at $20.27 -- merely a decline of 5% -- while the DJIA declined by 13%. MO has a dividend yield of 7%, higher than many stocks. Although its price will not skyrocket anytime soon, we also know that a crashing market will barely hurt it. While the market dithers and decides what to do, we can increase returns on stocks like MO, beyond collecting dividends, by writing covered calls against the stock. Conceptually, this is easy to understand. But to do this year after year successfully is easier said than done. But it can be done if you have a plan. Doing this blindly will result in a frustrating experience of high premiums with stocks called away time after time. Another problem is the prevalent attitude of the premiums being too low, meaning it isn't worth the trouble. If the story of our stock is upbeat and their products and/or service are in demand, we don't want our stocks called away, because we want those dividends. Timing the writing of covered calls is key to success here, and the timing plan must be followed in a disciplined manner. My guide in this? Bollinger bands. BOLLINGER BANDS The purpose of the bands is to define relative highs and lows of the stock. When the stock price reaches the upper band, it is perceived to be relatively high and expected to go down toward the 20-day MA, or the middle band, and perhaps to the lower band. When the stock price touches the lower band, it is perceived to be relatively low and is expected to move up toward the 20-day MA, and perhaps to the upper band. When the bands lie close together, a period of low volatility is expected in the near future. When the bands are far apart, a period of high volatility is expected. The Bollinger bands can be calculated as follows:
USING BOLLINGER BANDS
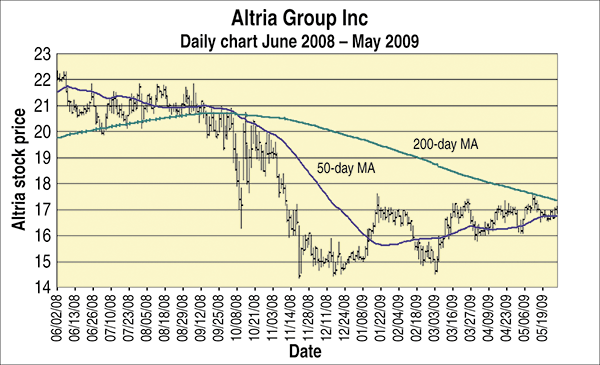
FIGURE 1: ALTRIA GROUP (MO) FROM JUNE 2, 2008 TO MAY 19, 2008. Note that the 50-day MA has started to trend up and is at the point of crossing above the 200-day MA. Example:
Rule 1: MO's 50-day MA has started to trend up and is at the point of crossing over above the 200-day MA. This qualifies as close to trending up.
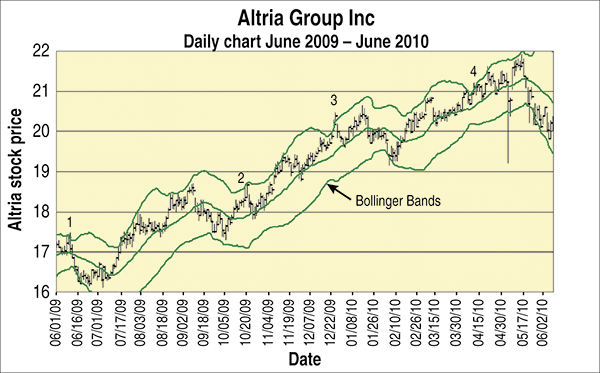
Rule 2: MO's beta is 0.38. Rule 3: Since June 2009 to June 2010, we were able to sell covered calls four times. Figure 2 shows MO's price action during that period with corresponding Bollinger bands.
FIGURE 2: USING BOLLINGER BANDS. Points 1-4 represent where covered calls were sold.
The numbered points on the chart indicate the dates when the covered calls were sold. In point 1 it was June 9, 2009, and the stock price was at $17.40. A September 19 call was sold at $0.15 per share or $15 per contract, expiring on September 18, 2009. Price at expiration was $17.96, which means the calls expired worthless, with the full profit on selling the covered call the premium of $15, minus commissions of $8.95, or $6.05. Most people would think a transaction of $6.05 was not worth the trouble. If you've never done this, it takes some time to set up your Excel spreadsheet. You have to download the data (I use finance.yahoo.com), sort the data so the earliest appears first, and set up your columns. My columns are:
Lay out everything so you understand what you're doing. And yes, it helps to be proficient in Excel.
Rule 4: The September 16 calls were sold since the July calls didn't have enough value to cover commissions, and December ones were too far out. Rule 5: As it worked out, MO stock was never called away, and all four transactions wherein calls were sold were profitable. Figure 3 shows the results of the four transactions.
FIGURE 3: CALLS WRITTEN ON MO, JUNE 2009-JUNE 2010. Adding the $29.20 to dividends of $135 gives a total of $164.20. Let us not forget to add the capital gain of $289.05, which results in a 25.4% return. Do you see on column 9 how those premiums add up? Add to the $29.20 the dividends of $135 collected for the year that gives a total of $164.20 total cash inflow, or a return of 9.6% ($164.20/($1,710 + $8.95 commissions). This is certainly better than certificates of deposits or Treasury bills. Add to that the capital gain of $289.05 and it gives a total of $453.25, or a total return of 25.4%. What if the September 19 call you wrote on June 9, 2009, resulted in the stock getting called away? Results are displayed in Figure 4. Results are still pretty good.
FIGURE 4: STOCK CALLED AWAY. This still results in a 10.4% return. Once you set up your Excel spreadsheet for one stock, the rest will take only a few minutes each to set up. On a daily basis, you need update only those whose prices are close to when calls can be written. Updating will take even less time. |
SUGGESTED READING
|
Teresa Fernandez is a private investor and technical analyst of the US stock market. Since earning an MBA in finance from the Wharton School of Business, she has researched disciplines that can be used by the ordinary investor to make money in the stock market. Fernandez has taught her philosophy of disciplined investing since 1997.
| E-mail address: | teresa.fernandez.wg72@wharton.upenn.edu |
PRINT THIS ARTICLE

Request Information From Our Sponsors
- StockCharts.com, Inc.
- Candle Patterns
- Candlestick Charting Explained
- Intermarket Technical Analysis
- John Murphy on Chart Analysis
- John Murphy's Chart Pattern Recognition
- John Murphy's Market Message
- MurphyExplainsMarketAnalysis-Intermarket Analysis
- MurphyExplainsMarketAnalysis-Visual Analysis
- StockCharts.com
- Technical Analysis of the Financial Markets
- The Visual Investor
- VectorVest, Inc.
- Executive Premier Workshop
- One-Day Options Course
- OptionsPro
- Retirement Income Workshop
- Sure-Fire Trading Systems (VectorVest, Inc.)
- Trading as a Business Workshop
- VectorVest 7 EOD
- VectorVest 7 RealTime/IntraDay
- VectorVest AutoTester
- VectorVest Educational Services
- VectorVest OnLine
- VectorVest Options Analyzer
- VectorVest ProGraphics v6.0
- VectorVest ProTrader 7
- VectorVest RealTime Derby Tool
- VectorVest Simulator
- VectorVest Variator
- VectorVest Watchdog


