HOT TOPICS LIST
- Strategies
- Stocks
- Buy
- Investing
- Brokers
- Psychology
- Interviews
- Accumulate
- Sell
- Hold
- Spotlight
- Websites
- Candlestick Corner
- Gold & Metals
- Options Trading
LIST OF TOPICS
TRADER'S NOTEBOOK
Exploiting The Holidays With The Stock Market
12/22/10 09:40:11 AM PSTby Mark Vakkur
Yes, Virginia, there is (still) a Santa Claus rally. And more!
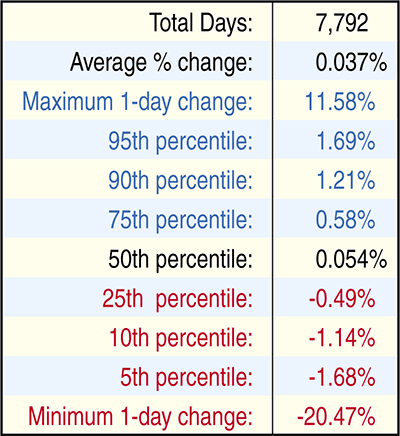
Martin Zweig once quipped that the only thing wrong with holidays was that there weren’t more of them. Yale Hirsch’s Stock Traders Almanac has memorialized this seasonal pattern in poetic form: If Santa Claus should fail to call, After so much publicity over the years, it is amazing that this end-of-year seasonality has not disappeared; it remains as strong as ever. In this article, I will explore ways of exploiting Christmas and end-of-year seasonality. The Standard & Poor’s 500 has a tendency to rise the day before and after Christmas, and this bullishness extends through the final trading days of the year. To appreciate the magnitude of this rise, it’s first necessary to define average. Figure 1 shows the statistical breakdown of the S&P 500 for every trading day from 1980 through November 19, 2009. Note that the market rose an average of 0.037%, which works out to 9.82% annualized (assuming 250 trading days per year). But this average return was scattered over a dramatic range from a single plunge of 20.47% on one extreme to a surge of 11.58% on the other. Now, 90% of the time, the market’s daily change was between 1.69% and 1.68%. Note that the mean (0.037%) is less than the median (0.054%), which indicates that the average was pulled down by extreme outliers. Put another way, the market has experienced more extreme downside days than extreme upside days. The market rose slightly over half (52.96%) of the time or 4,127 of the total days in the sample period.
FIGURE 1: DAILY PERCENTAGE CHANGE (CLOSE-CLOSE) IN THE S&P 500 (1980–NOVEMBER 2009). The market rose an average of 0.037%, which works out to 9.82% annualized. The range was from 20.47% to +11.58%. The market experienced more extreme downside days than extreme upside days. |
| THE SANTA CLAUS RALLY In order to calculate how the market performed on the days prior to and following Christmas, I had to anchor the data for each year on Christmas Day, when the market was closed, and then work backward and forward three days. I numbered the days prior to Christmas C-3 (for the third to last trading day before Christmas) to C-1 (for the final trading day before Christmas). Note that C-1 may or may not have been Christmas Eve, depending on when Christmas actually fell on a given year. I did the same for the days following Christmas, with C+1 indicating the first trading day after Christmas, out to C+3. The results from 1980 to 2009 are displayed in Figure 2.
FIGURE 2: AVERAGE DAILY CHANGE ON THE S&P 500, THREE DAYS BEFORE AND THREE DAYS AFTER CHRISTMAS (1980–2009). Each of the three days prior to Christmas is strong, closing up over 60% of the time. The days following Christmas also have above-average returns with the exception of the second trading day after Christmas, when the market rises only 0.03% (8.7% annualized), although the percentage of times the market rose is an above-average 57%. Three days following Christmas is the strongest of the six trading-day series. The fourth trading day is down 0.17% on average and rose less than half the time (47%). Each of the three days prior to Christmas is strong, closing up over 60% of the time. The last trading day before Christmas closes up 67% of the time. Each of the three days has an above-average return; if every day were the final trading day before Christmas, the S&P 500 would return 77.7% a year! The days following Christmas are also above average in return, with the exception of the second trading day after Christmas, when the market rises only 0.03% (8.7% annualized), although the percentage of times the market rose is an above-average 57%. Three days following Christmas is the strongest of the six trading-day series, perhaps because of momentum from the Christmas rally or anticipation of the end of the year. The fourth trading day is down 0.17% on average and rose less than half the time (47%). You could use these results in several different ways, the most obvious going long three trading days prior to Christmas, then exiting on the third day after Christmas. Using this strategy would generate the returns you see in Figure 3.
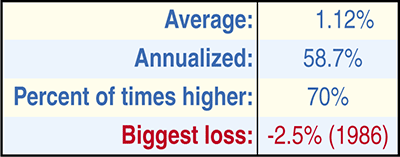
FIGURE 3: AVERAGE SIX-DAY CHANGE IN THE S&P 500 FROM THE THREE TRADING DAYS BEFORE CHRISTMAS TO THREE TRADING DAYS AFTER CHRISTMAS (1980–2009). The six trading-day span generated 1.12% on average, which works out to 58.7% annualized. |
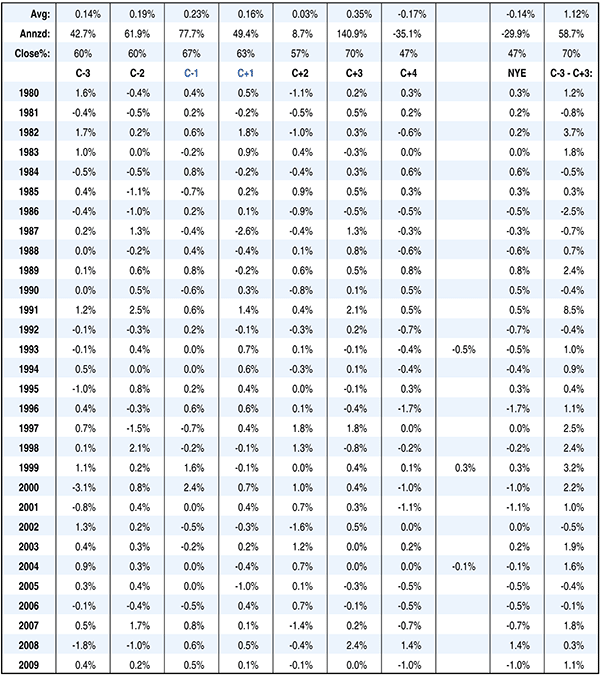
| The six-trading-day span generated 1.12% on average, which works out to 58.7% annualized. This trade would generate a profit in seven out of 10 years. In fact, since 1992, there have only been three down years with this strategy (2002, 2005, and 2006), all losses of less than 1%. During the entire 30-year span, the biggest loss was 2.5% in 1986; all the other losing years were 0.8% or less. (See sidebar, “Year-By-Year Data For S&P 500: 1980–2009.”) NEW YEAR’S EVE AND FIRST TRADING DAY
FIGURE 4: NEW YEAR’S EVE AND NEW YEAR’S DAY S&P 500 PERCENT CHANGE, NEW YEAR’S EVE 1980 TO FIRST TRADING DAY OF 2010. Unfortunately, the Santa Claus rally, despite popular folklore, does not tend to persist into the New Year period. The final trading day of the year is down 0.14% on average (29.9% annualized) and rose less than half the time (47%). Although the first trading day of the New Year rose 0.19% average (62.7% annualized), it was very spotty, rising only 43% of the time.
The final trading day of the year is down 0.14% on average (29.9% annualized) and rose less than half the time (47%). Although the first trading day of the new year rose 0.19% average (62.7% annualized), it was very spotty, rising only 43% of the time. COMBINING THE STRATEGIES
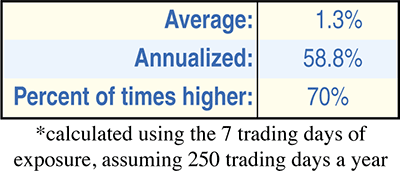
FIGURE 5: RESULTS OF TRADING THE THREE TRADING DAYS PRIOR TO AND AFTER CHRISTMAS AS WELL AS THE FIRST TRADING DAY OF THE NEW YEAR 1980 TO FIRST TRADING DAY OF 2010. The optimal strategy would be to go long three trading days prior to Christmas, exit the market three trading days after Christmas, then go long for the first trading day of the New Year. Such a strategy would have generated the above results. |
| CONCLUSION Year-end holiday seasonality remains strong, especially three days prior to and after Christmas, as well as the first day of the New Year. Traders can exploit these trends, which show no recent evidence of weakening, and investors can use them for fine-tuning their exits from the market. A position to be liquidated toward the end of the year, for example, should be sold during the week between Christmas and New Year, all things being equal. Those wanting to take new positions in stocks, especially if they anticipate a January rally, should do so in December, three trading days before Christmas.
SIDEBAR: YEAR-BY-YEAR DATA FOR S&P 500: 1980–2009 |
Mark Vakkur is a private investor and trader.
PRINT THIS ARTICLE

Request Information From Our Sponsors
- StockCharts.com, Inc.
- Candle Patterns
- Candlestick Charting Explained
- Intermarket Technical Analysis
- John Murphy on Chart Analysis
- John Murphy's Chart Pattern Recognition
- John Murphy's Market Message
- MurphyExplainsMarketAnalysis-Intermarket Analysis
- MurphyExplainsMarketAnalysis-Visual Analysis
- StockCharts.com
- Technical Analysis of the Financial Markets
- The Visual Investor
- VectorVest, Inc.
- Executive Premier Workshop
- One-Day Options Course
- OptionsPro
- Retirement Income Workshop
- Sure-Fire Trading Systems (VectorVest, Inc.)
- Trading as a Business Workshop
- VectorVest 7 EOD
- VectorVest 7 RealTime/IntraDay
- VectorVest AutoTester
- VectorVest Educational Services
- VectorVest OnLine
- VectorVest Options Analyzer
- VectorVest ProGraphics v6.0
- VectorVest ProTrader 7
- VectorVest RealTime Derby Tool
- VectorVest Simulator
- VectorVest Variator
- VectorVest Watchdog


