HOT TOPICS LIST
- Strategies
- Stocks
- Buy
- Investing
- Brokers
- Psychology
- Interviews
- Accumulate
- Sell
- Hold
- Spotlight
- Websites
- Candlestick Corner
- Gold & Metals
- Options Trading
LIST OF TOPICS
THE CHARTIST
Using Cycle Deviations
01/31/11 09:14:59 AM PSTby Martha Stokes, CMT
Cycles come in all forms and sizes, but what's a cycle deviation? It's something to keep your eye out for.
| Many traders like to use cycles and cycle theory for a trading system or strategy, but using known cycles to time the market is only the beginning. Every trader has heard of the four-year stock market cycle, six-year business cycle, and economic cycles. Few traders realize that all cycles, no matter how long or short, occasionally encounter what is referred to as a cycle deviation. These deviations can range from mild to severe. Deviations create shifts in cycle timelines, which can cause problems for trading systems and strategies based on these cycles. MARKET EARTHQUAKES What most traders don't realize is that by averaging the data, anomalies and discrepancies are eliminated, creating the illusion of a steady, reliable, and consistent four-year cycle. Unfortunately, cycles are rarely perfect on the trough cycle timelines based on their averages. A four-year cycle could have a trough-to-trough cycle that lasts for five years or as short as two and a half and still average out to be a four-year cycle. The key to using cycle timelines is to be aware of the minor shifts and adjust for them, but also to be aware of when a major deviation is occurring that will alter the cycle, not by a year or so but by several years. Most deviations are minor and do not alter the cycle permanently. However, some deviations create huge shifts, similar to the way a fault line, where an earthquake originates, does. Earthquakes do not occur at regular cyclical intervals and a major earthquake can move that fault line and the land around it on a lasting basis. Major cycle deviations are the earthquakes of the financial markets and the catalysts that cause cycles to change. This is part of the evolution of financial markets and is necessary for the continued growth and expansion of the global financial marketplace. |
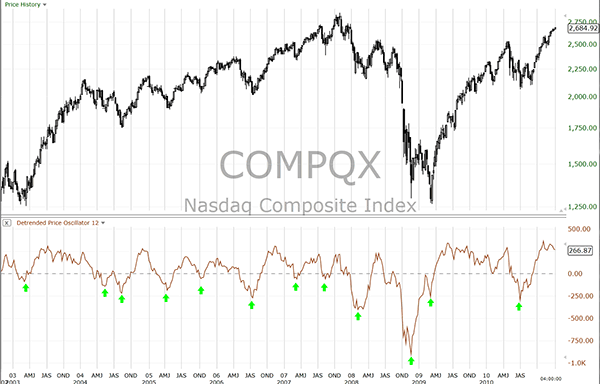
| CYCLE DEVIATION ANALYSIS In recent years, the financial markets have suffered a major deviation of the normal cyclical pattern, causing an extreme trough pattern. By applying a detrending indicator on a weekly chart, we can pinpoint the cycle deviation, what cycle existed before the deviation, and how the cycle has been altered since then. For this example, we will use a common detrending oscillator with a period of 12 to expose a nine-month cycle. A detrending indicator removes the trend from the chart to reveal the cycle, if there is one present. Not all stocks have cycles. For this analysis, it is best to use an index of a major market, industry, or sector. By applying the detrending indicator, the trends are eliminated and the cycle patterns are revealed, as seen in Figure 1 for the NASDAQ 100 Composite Index chart. A consistent trough-to-trough cycle pattern occurred between 2003 and 2007. In 2008-09, a major deviation of the cycle occurred.
FIGURE 1: DETRENDED PRICE OSCILLATOR. The detrending indicator eliminates the trends and the cycle patterns are revealed as seen on the NASDAQ 100. A very consistent trough-to-trough cycle pattern occurred between 2003 and 2007. In 2008-09, a major deviation of the cycle occurred. Of course, just because price moves down, that doesn't mean a major cycle deviation occurred. As you will see later in this article, some industries did not have a major cycle deviation in 2008-09, despite the fact that the industry moved down in value during that period. This major deviation needs to be analyzed and studied in order to understand how it will affect cycles in the near term and for how long. If a trader were to continue to use the previous cycle as a basis for timing the NASDAQ, his/her cycle analysis would quickly fail. For most cycle theorists and traders, this is a new approach to using cycles. Most are unaware that such deviations cause huge shifts in the known cycle that can last for many years or even permanently. |
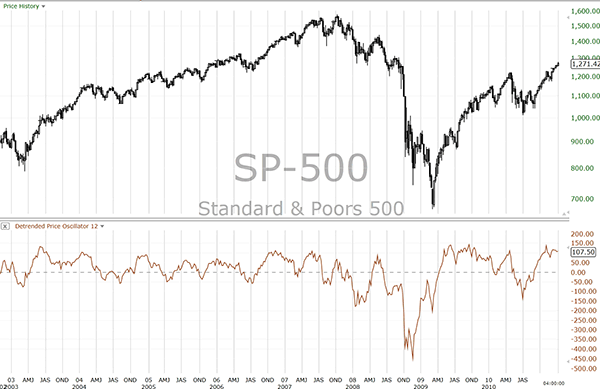
| In the 20th century, cycle theorists were busy trying to prove that cycles existed in the financial markets, so it was necessary to average and smooth out the anomalies. Deviations were ignored in favor of proving that a cycle did exist. To prove the existence of a cycle, a persistent cycle timeline had to be found. Averaging provided the proof. However, by averaging to identify the cycle timeline, it also disguised any deviation that was present. Today, it is important to use cycle theory beyond the scope of merely identifying a particular cycle duration or length. As our markets expand and change, deviations have to be analyzed. Cycle deviation analysis provides a better understanding of our current stock market cycles. In addition, it helps traders develop better tools, trading systems, and strategies to counter the effect of the deviation on known cycle timelines. Cycle deviation analysis will help traders understand what is likely to follow a major disruption of a cycle. Let's examine the Standard & Poor's 500, the most widely used index for determining market cycles and activity. The detrending price oscillator removes the trend, leaving the cyclical patterns intact. Most charting software has some version of a detrending indicator. A common formula is: ----------------------------------------------------------------------- In Figure 2, the extreme trough that formed in early 2009 is a serious deviation from the norm and signals a huge shift in the cycle pattern and timeline.
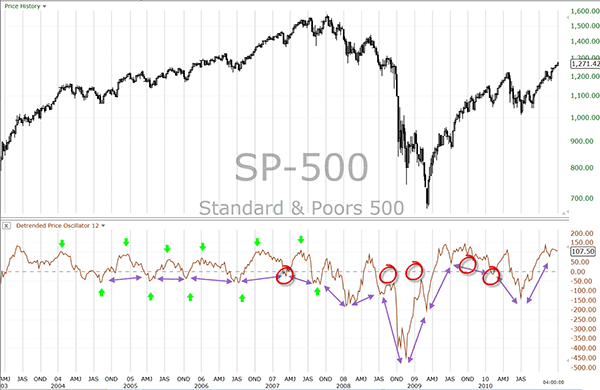
FIGURE 2: MARKET CYCLES AND ACTIVITY. The extreme trough that formed in early 2009 was a serious deviation from the norm and signaled a huge shift in the cycle pattern and timeline. Using a weekly chart with a 12-period detrending price oscillator to reveal the cyclical patterns of the S&P 500, it becomes obvious that between 2003 and 2007, a consistent cycle formed with consistent troughs and peaks that held within a range that is easy even for a novice cycle analyst to discern. In Figure 3 you see the same chart with cycle deviation analysis applied to expose the major deviation and how it has altered the cycle timeline. The green markers identify the peaks and troughs for each cycle. By using the two-headed arrow, it becomes easier to see how the cycles shift from normal to abnormal. The red circles indicate either a failure to trough or a failure to peak. These may seem inconsequential to a novice, but to a cycle deviation analyst, these patterns are early warnings of timeline shifts that will cause the cycle to be out of sync with its normal pattern for many years. In particular, the failed peaks prior to the huge trough are most significant. Failed peaks warn early that the downside will be a far more serious correction.
FIGURE 3: CYCLE DEVIATION ANALYSIS. The green markers identify the peaks and troughs for each cycle. By using the dual arrow, it becomes easier to see how the cycles shifted from normal to abnormal. The red circles indicate either a failure to trough or a failure to peak. These patterns are early warnings of timeline shifts that will cause the cycle to be out of sync with its normal pattern for many years. In particular, the failed peaks prior to the huge trough are most significant. Failed peaks warned early that the downside was going to be a far more serious correction. |
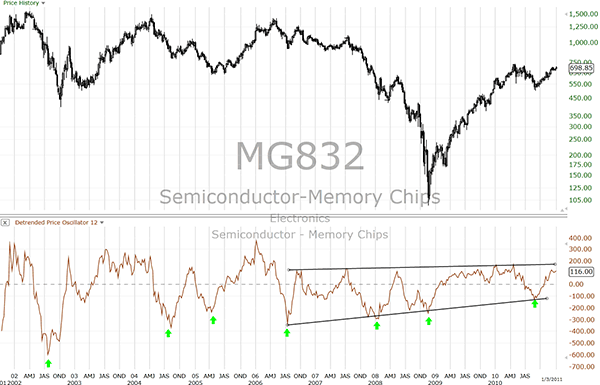
| WHAT DOES THIS REVEAL? What does all this mean? First, the correction in early 2008 was a major tear in the cycle timeline. Anytime there is a major structural change to a cycle, the next several cycles will be abnormal. The first cycle peak formed below the centerline with a considerably shortened trough timeline. The next peak formed too early and the trough failed completely. This trough failed to move through the centerline and is considered a failure-to-trough pattern. The trough following that one barely grazed the centerline and is still considered a failure-to-trough because it didn't cycle down as it normally would. The magnitude of this deviation caused a huge disruption in the timeline of the cycle. Where it normally troughed every nine months on average, the cycle became unpredictable and distorted with both shortened and extended legs through the cycle. So instead of a nine-month cycle, the deviation created one five-month cycle followed by a 13-month cycle, followed by a four-month cycle, and then a 16-month cycle. Clearly, using an average on these extreme, deviant cycle troughs would give wrong data to a trader about the S&P 500 cycle. Ignoring the impact of that deviation on the cycle would have caused serious trading errors and potentially huge losses. Being aware that a major deviation occurred allows you to prepare for major shifts and anomalies in the normally consistent cycle. During the period of the major deviation, peaks and troughs not only failed but compressed the timeline and then expanded it, creating several cycles that diverged from the previous 2003-07 cycles. Did every index or industry experience such a major deviation to the normal cyclical patterns during the market collapse of 2008-09? No, not all. For example, Semiconductor Memory Chips (Figure 4) did not experience the same cycle deviation as the S&P 500 in 2008-09, even though price values declined.
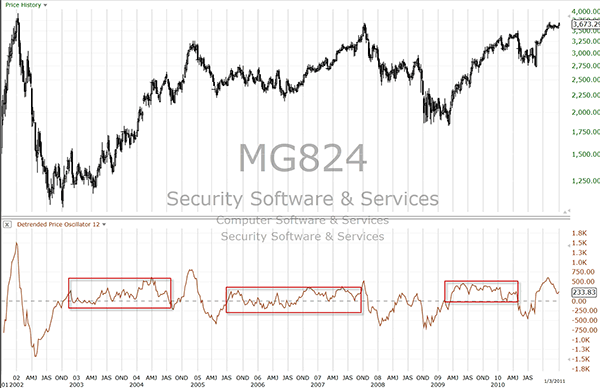
FIGURE 4: CYCLES IN THE SEMICONDUCTOR MEMORY CHIPS SECTOR. During 2008-09, the semiconductor industry did not experience the same cycle deviation as the S&P 500, even though price values declined. Note that this industry sector did suffer a major deviation in its cycle back in 2002 and has been forming inconsistent cyclical patterns ever since. The cycles of this sector remain unstable and less reliable, and the entire cycle pattern is slowly compressing. The Security Software and Services sector had no deviation in its cyclical pattern in 2008-09. This is in stark contrast to S&P 500, NASDAQ 100, and Dow Jones Industrial Average, which all suffered major cycle deviations. In Figure 5 you see the chart for the Security Software and Services sector. This sector also experienced a major deviation pattern in 2000 with an extreme peak pattern followed by a reverberating trough of slightly less magnitude. The compression patterns are similar to aftershocks. This cycle is working on recovering and developing a normal cyclical pattern, but for now, the cycles are not reliable.
FIGURE 5: SECURITY SOFTWARE AND SERVICES SECTOR. This sector had no deviation in its cyclical pattern in 2008-09. It experienced a major deviation pattern in 2000 with an extreme peak pattern followed by a reverberating trough of slightly less magnitude. This cycle is still working on recovering and developing a normal cyclical pattern. But for now, the cycles are not reliable. CYCLES ARE COMPLEX Most cycle theory during the 20th century was based on the concept that the stock market could be made to conform to the laws of physics and mathematics and that everything about the market could be computed into a simple mathematical equation or formula. More recently, theorists have begun to realize that pure physics and math do not account for all that occurs in the financial markets or economics. Major disruptive forces can't be explained or computed by pure math. In fact, the quantitative analysis used to create the credit default swaps that instigated the cycle rip in the financial markets in 2008 were predicting continued expansion and growth in the real estate markets. What was not calculated were emotions and reactions. The financial markets behave more like complex biological ecosystems than the laws of physics. For traders who rely on mathematical equations for trading, think of the cycles of the financial markets as an ever-changing ecosystem with layers of patterns and conditions that create cycles of varying lengths. Think of a major deviation of a cycle as a sudden disruptive force. The best way to imagine this is to think in terms of a coral reef. A coral reef is part of the ocean, existing between the depths of the sea and the land mass. It is complex and constantly changing due to internal and external forces, such as climate, evolution of species, impact from humans, and ocean currents. A deviation from the normal cycles of a coral reef would be a tsunami that alters the coral reef, the shoreline, and the sea life living in the reef. Sometimes after a tsunami, the change to the coral reef is permanent. The financial markets are just as complex. A cycle timeline alone will not provide the data and facts you need to anticipate what will occur next. If a deviation is ignored, then the consequences to trading strategies and systems could be catastrophic. Since the banking debacle and financial market collapse of 2008, most traders have been struggling with trading systems that are not working as they once did. Many traders feel the markets are confusing, volatile, and even unstable. One problem is that too many traders are holding onto the cycle timelines of the past, expecting them to behave as they did before 2008. |
| What they do not know is that a major cycle deviation has occurred in the markets and its impact will reverberate for many years to come. Cycles will behave differently, forming different trough-and-peak patterns than in the past. In order to take advantage of this cycle deviation, you must learn to apply cycle deviation analysis. A good place to start is to use the detrending price oscillator to identify the original cycle, and to study the abnormal cycles following the major deviation. The basis for cycle analysis should not be merely the application of a mathematical average but an analysis of the anomalies, minor and major deviations, and patterns within the cycles so that a better perspective on what is more likely to occur next can be made. In this way, traders can be ready to adapt more quickly and respond to the changes going on around them due to cycle shifts and cycle deviations. RELATED READING |
Martha Stokes, lecturer and author of Cycle Evolution Theory, is a master-rated technical analyst for TechniTrader stock market trading courses, workshops, and virtual classes. In addition, she writes several educational newsletters for active traders. To learn more, visit www.technitrader.com or www.marthastokes.com.
PRINT THIS ARTICLE

Request Information From Our Sponsors
- StockCharts.com, Inc.
- Candle Patterns
- Candlestick Charting Explained
- Intermarket Technical Analysis
- John Murphy on Chart Analysis
- John Murphy's Chart Pattern Recognition
- John Murphy's Market Message
- MurphyExplainsMarketAnalysis-Intermarket Analysis
- MurphyExplainsMarketAnalysis-Visual Analysis
- StockCharts.com
- Technical Analysis of the Financial Markets
- The Visual Investor
- VectorVest, Inc.
- Executive Premier Workshop
- One-Day Options Course
- OptionsPro
- Retirement Income Workshop
- Sure-Fire Trading Systems (VectorVest, Inc.)
- Trading as a Business Workshop
- VectorVest 7 EOD
- VectorVest 7 RealTime/IntraDay
- VectorVest AutoTester
- VectorVest Educational Services
- VectorVest OnLine
- VectorVest Options Analyzer
- VectorVest ProGraphics v6.0
- VectorVest ProTrader 7
- VectorVest RealTime Derby Tool
- VectorVest Simulator
- VectorVest Variator
- VectorVest Watchdog

