HOT TOPICS LIST
- Strategies
- Stocks
- Buy
- Investing
- Brokers
- Psychology
- Interviews
- Accumulate
- Sell
- Hold
- Spotlight
- Websites
- Candlestick Corner
- Gold & Metals
- Options Trading
LIST OF TOPICS
THE CHARTIST
The Kairi Relative Index
02/28/11 01:12:37 PM PSTby John Devcic
It's pretty much been forgotten over the years. But can this indicator still be useful?
| They call it the forgotten oscillator. The last time it saw any real significant use was during the 1970s. Traders and investors have all but ignored it in recent decades. While the kairi relative index (KRI) is a long-abandoned indicator, called useless by some, does it still have value? BACKGROUND A momentum oscillator measures the strength of the up or down movement of price instead of the actual price level. The harder and faster a tradable's price falls, the bigger the oscillator move. The same goes for an upward move. Once the price move slows down, so does the momentum oscillator. So the kairi measures the strength of the move of a security. Now we need to dig deeper to figure out how it calculates the strength of a move. To calculate the kairi, you need the latest price of the security you are following and its simple moving average (SMA). The KRI is calculated using the difference between the latest price and its simple moving average (SMA), which it expresses as a percentage of the moving average. The formula is straightforward: KRI = Price - SMA over X periods divided by the SMA over X periods and multiplied by 100 The default SMA is 10, but some prefer to use a 20-day moving average for better results. Now that we can calculate it, we need to figure out how it can best be used. |
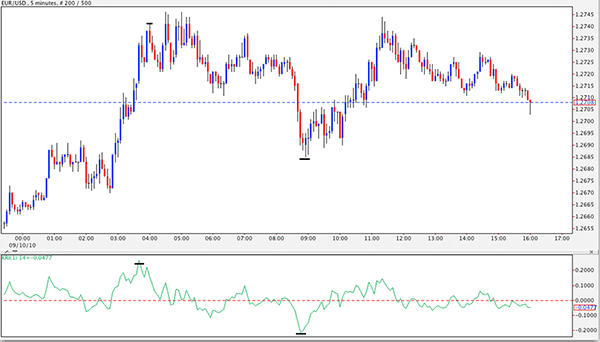
| When it comes to using the kairi, there are basically two levels that should spur you to action. The first level is high and positive. If you see this level, the kairi is telling you that the security is in overbought territory and it is time to sell. The other level occurs when you get a reading of large and negative, which is a call to buy. These are extreme situations, and when they are seen, it is best to follow through and sell or buy, depending upon the level. KRI is a center line indicator and the center line is set at zero. You will probably not plot the kairi on a chart yourself; you will most likely use charting software to do it for you. You can choose to either display the kairi overlaid on a chart or in a separate panel. OUT IN THE WILD The five-minute chart of the euro/US dollar (EUR/USD) in Figure 1 is for September 9, 2010. Two points are marked on the chart to illustrate the index's effectiveness. The first is shortly after midnight, when the move down bottoms below 0.10 level on the kairi displayed under the chart. The KRI was in an oversold situation. The situation occurs again a few hours later when another short cover or buy was signaled by the kairi. Later that day at around 5 pm, the KRI signaled an overbought situation. At that point, the EUR/USD had run into the +0.200 level, signaling a perfect time to close out your long position or initiate a new short position.
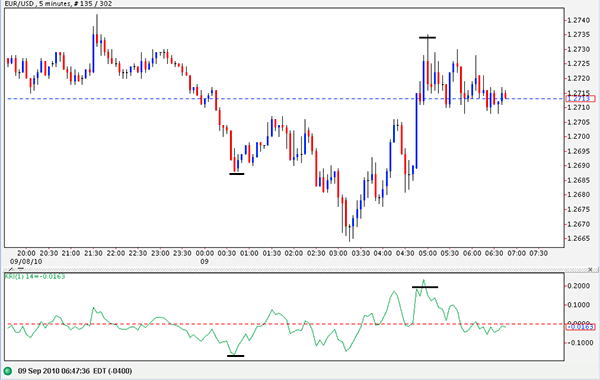
FIGURE 1: FIVE-MINUTE CHART OF THE EUR/USD. The KRI moves below 0.10 level shortly after midnight on September 9, 2010. Later that day, around 5:00 pm the KRI signaled an overbought situation when it hit +0.20. This indicated that you should close out your long positions or initiate a short position. A day later on September 10, note the kairi on a five-minute chart of the EUR/USD (Figure 2), heading up. From midnight on, the move was basically straight up until around 3:00 am, when the KRI went well past the +0.20 level, signaling an overbought situation. |
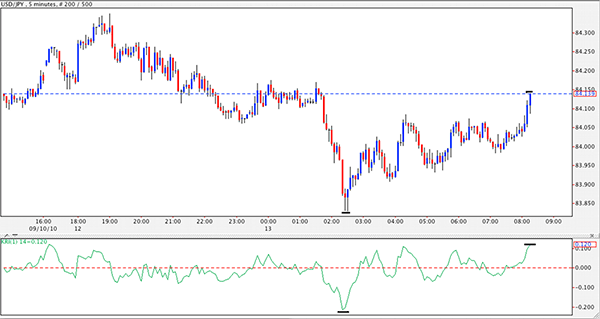
 FIGURE 2: THE FOLLOWING DAY. On September 10, 2010, the KRI went well above the +0.20 level. By 9:00 am the KRI had fallen to the 0.20 level. The EUR/USD did retrace but went back up at around 5:00 am and tested the high twice. The next line on the chart is at 9:00 am, when the kairi indicates an oversold situation when the index was in the 0.20 level. Usually, there is an immediate move toward the center line, followed by a minor retracement to the downside before the move heads back toward the center line. In this case, that did not happen. What happened was an immediate move back to and above the center line. Figure 3 shows the five-minute chart of the US dollar/yen (USD/JPY) for September 13. At 2:00 am, there's a strong move to the downside. The KRI dropped until it hit the 0.20 level, indicating that the USD/JPY was deep in oversold territory. In this case, it did not fall any lower, moving back to the center line and eventually above it -- all the way until shortly after 8:00 am, when the move to the upside reached overbought territory. Then the kairi was in the +0.12 level, signaling that a change of direction was likely to occur.
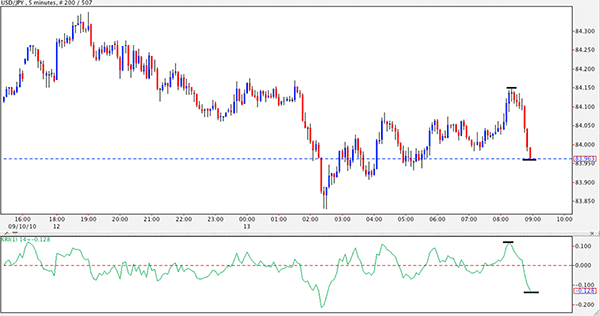
FIGURE 3: FIVE-MINUTE CHART OF THE USD/JPY. On September 13, 2010, you see a very strong move to the downside. The KRI fell rapidly until it hit the 0.20 level. Shortly after 8:00 am, the move to the upside hits overbought territory. After that, Figure 4 shows a five-minute chart of USD/JPY for September 13. You can see what happens from 8:00 am to 8:57 am (shortly before the end of the candle). In that hour, the USD/JPY moves to the downside aggressively. It goes from an overbought situation into an oversold situation at 0.1280. The momentum of the move is illustrated perfectly by the kairi. |
 FIGURE 4: A LOT CAN HAPPEN IN AN HOUR. Just before 9:00 am, the USD/JPY moves aggressively to the downside. It moves from an overbought situation into an oversold one at 0.1280. So the kairi does have its uses. There is a compelling reason why the KRI has been forgotten, and it's called the relative strength indicator (RSI). RELATIVE STRENGTH INDEX RSI = 100 - 100/(1 + RS) According to Wilder, when a security moves down rapidly in price, it reaches a certain point where the pressure is too much. At this level, the security is being oversold. The same goes for overbought territory. Wilder said seeing either level means a reversal would take place soon. On a chart, the RSI will appear as a line similar to the KRI. Depending on where the line falls with respect to oversold/overbought levels, you will get an idea of the current state of buying or selling pressure on the security. |
| IN COMPARISON While the kairi relative index, though outdated, has value, it does essentially what the RSI has been successfully doing since the late 1970s, indicating levels of overbought and oversold areas. The RSI is easily available on almost all charting software, free or otherwise. Many books and articles have been written on it, so it is also a well-established oscillator. Not all charting software packages will have the kairi. The difficulty lies in finding charting software that will allow you to use it. SUGGESTED READING |
John Devcic is a market historian and freelance writer. He may be reached at drmorgus@gmail.com
| E-mail address: | drmorgus@gmail.com |
PRINT THIS ARTICLE

Request Information From Our Sponsors
- StockCharts.com, Inc.
- Candle Patterns
- Candlestick Charting Explained
- Intermarket Technical Analysis
- John Murphy on Chart Analysis
- John Murphy's Chart Pattern Recognition
- John Murphy's Market Message
- MurphyExplainsMarketAnalysis-Intermarket Analysis
- MurphyExplainsMarketAnalysis-Visual Analysis
- StockCharts.com
- Technical Analysis of the Financial Markets
- The Visual Investor
- VectorVest, Inc.
- Executive Premier Workshop
- One-Day Options Course
- OptionsPro
- Retirement Income Workshop
- Sure-Fire Trading Systems (VectorVest, Inc.)
- Trading as a Business Workshop
- VectorVest 7 EOD
- VectorVest 7 RealTime/IntraDay
- VectorVest AutoTester
- VectorVest Educational Services
- VectorVest OnLine
- VectorVest Options Analyzer
- VectorVest ProGraphics v6.0
- VectorVest ProTrader 7
- VectorVest RealTime Derby Tool
- VectorVest Simulator
- VectorVest Variator
- VectorVest Watchdog


