HOT TOPICS LIST
- Strategies
- Stocks
- Buy
- Investing
- Brokers
- Psychology
- Interviews
- Accumulate
- Sell
- Hold
- Spotlight
- Websites
- Candlestick Corner
- Gold & Metals
- Options Trading
LIST OF TOPICS
TRADER'S NOTEBOOK
Elliott Wave And The Explosive Stock
03/10/11 02:54:07 PM PSTby Ryan Henry
Using the Elliott wave theory, you can find stocks that are ready to skyrocket.
| We all have one goal in mind in this trading game: We want to find winning investments that leave our accounts better off than where they started. Many traders seek to accomplish this goal by digging through financial statements, news articles, and trade magazines in search of companies with exploding earnings or industry-changing innovations in the works. No doubt, these things create a ton of potential in terms of a company's stock growth. But we have no way of knowing how the market will react to even the most promising headlines. Just watch how the price of a stock changes after it beats earnings. Sometimes it goes up, but it can just as easily go down. If you're lucky enough to find a stock that will beat expectations, the only solace you'll get to a negative market reaction is that the market didn't like the company's sales figures in eastern Tunisia. Personally, that's not a game I want to play. Fortunately, we don't have to play that way. There is a way to identify stocks that are ready to make strong price moves right away, regardless of earnings announcements or the newswire. Elliott wave theory is the answer. We don't need to go through the pain of wondering how an event will affect a company's stock price. Elliott wave theory clues us into a stock's intentions long before everyone is reading about it. First, let's talk about the basics of using the theory. That will allow us to look at how a successful trade is executed in the real world using this trading method. |
| ELLIOTT WAVE THEORY The Elliott wave theory is a pretty complicated one, one that is based on the predicted way a herd behaves over time. You could spend most of your waking hours studying and understanding the details and nuances of it all. But in the end, it all boils down to some simple concepts you can put to use by the time you've finished reading this article. At its base, Elliott wave is all about identifying price patterns as they play out on a chart. The theory tells us that there are two and only two types of price movement that can occur at any given time on a chart. There is trending or impulsive movement, which is the price action that occurs in the direction of the dominant trend. This type of price action is strong and direct, and it plays out in five phases or waves. The other type of price movement is countertrend or corrective movement. Again, this is the type of price action that occurs against the dominant trend. Unlike the impulsive movement, corrective movement tends to be slower and normally plays out in three phases or waves. When we use Elliott wave to trade, the goal is simple: for a long-side trade, we want to find a stock that has exhibited impulsive upside movement followed by corrective downside movement. If we can find that, we know that more impulsive upside movement is on the way. This may seem like a solution that is too easy for the difficult problem of finding consistent wins in the stock market. But after you watch the same thing play out time and time again, you'll understand that the old KISS adage ("keep it simple, stupid") has something to it. Let's look at a real-world example of how Elliott wave can sniff out big price moves before they happen. |
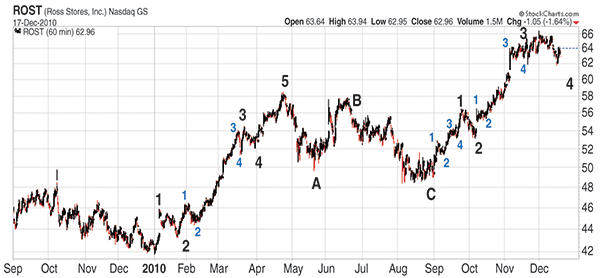
| ELLIOTT WAVES AND ROST Ross Stores (ROST) is a stock that had been on an impressive run for over a year and a half at the time this particular trade setup came to be (Figure 1). In fact, the stock had gained 174% in the 17 months leading up to the high it recorded in April 2010. For many traders, a move this big would be a deterrent since a stock can only climb so high, but the Elliott wave pattern told a different story.
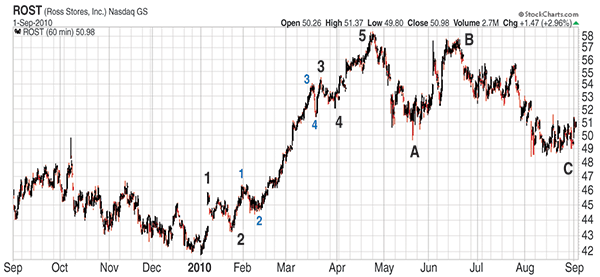
FIGURE 1: ROSS. Despite a monstrous advance in the preceding 17 months, the Elliott wave pattern on Ross Stores indicated massive gains were still on the way. During the first four months of 2010, ROST traced out a trending or impulsive Elliott wave pattern. The pattern is made up of five phases or waves overall. In addition, each of the advancing phases is composed of its own five phases. This is exactly the type of price movement we want to see to confirm an established uptrend. Once the five-wave pattern completed in late April, the stock embarked on a large pullback that persisted for four months. Unlike the trending upside action, the pullback was less direct. And most important, the decline played out in three phases as denoted by the ABC labeling on the chart. Since three-wave moves are countertrend moves, it could only mean that the trend was still up. At this point, the stage was set for another enormous five-wave advance. As a rule, we look for the pending five-wave advance to be similar in size to the initial five-wave advance -- in this case, 16 points. As soon as price began to advance again, it was time to go long. From there, it was just a matter of waiting for the gains to come in. Ross Stores embarked on another enormous five-wave advance that is still finishing up (Figure 2). The advance is about 17 points so far, or about 34% of the stock's value. |
 FIGURE 2: ROSS. Ross Stores explodes to the upside, following through on a very clear Elliott wave pattern that portended another big upleg. This is just one example of a successful trade using Elliott wave, but it happens over and over again. As long as you're able to identify impulsive and corrective price patterns, you too can use the Elliott wave theory to find stocks that are ready to explode.
SUGGESTED READING |
Ryan Henry is the author and lead analyst at www.wavespeak.com, an investment analysis firm with a profitable eight-year track record. Wavespeak provides market index forecasting and stock trade recommendations through a newsletter that is published three times a week. Wavespeak's analysis is driven by Elliott wave theory, but also includes consideration for Fibonacci mathematics, intermarket relationships, breadth, volume, and money flow analysis. Wavespeak provides samples of current market forecasts and a free newsletter on its website.
| Company: | wavespeak |
| Website: | www.wavespeak.com |
Traders' Resource Links | |
PRINT THIS ARTICLE

Request Information From Our Sponsors
- VectorVest, Inc.
- Executive Premier Workshop
- One-Day Options Course
- OptionsPro
- Retirement Income Workshop
- Sure-Fire Trading Systems (VectorVest, Inc.)
- Trading as a Business Workshop
- VectorVest 7 EOD
- VectorVest 7 RealTime/IntraDay
- VectorVest AutoTester
- VectorVest Educational Services
- VectorVest OnLine
- VectorVest Options Analyzer
- VectorVest ProGraphics v6.0
- VectorVest ProTrader 7
- VectorVest RealTime Derby Tool
- VectorVest Simulator
- VectorVest Variator
- VectorVest Watchdog
- StockCharts.com, Inc.
- Candle Patterns
- Candlestick Charting Explained
- Intermarket Technical Analysis
- John Murphy on Chart Analysis
- John Murphy's Chart Pattern Recognition
- John Murphy's Market Message
- MurphyExplainsMarketAnalysis-Intermarket Analysis
- MurphyExplainsMarketAnalysis-Visual Analysis
- StockCharts.com
- Technical Analysis of the Financial Markets
- The Visual Investor

