HOT TOPICS LIST
- Strategies
- Stocks
- Buy
- Investing
- Brokers
- Psychology
- Interviews
- Accumulate
- Sell
- Hold
- Spotlight
- Websites
- Candlestick Corner
- Gold & Metals
- Options Trading
LIST OF TOPICS
TRADER'S NOTEBOOK
The Sonar Trio Bottom Sounder
05/23/11 03:28:51 PM PSTby Matt Blackman
Many trading programs offer tools that promise to help you pick bottoms. The problem is, a single indicator may work well sometimes but poorly at others. Here is a set of indicators that do a respectable job consistently.
| The most popular pastime among traders and active investors may be bottom-picking. And although the practice is fraught with risk, the payoff for getting it right can be enormous. As a result, many systems have been touted over the years claiming to accomplish this task. However, few can consistently deliver through good times and bad, when markets are volatile as well as stable, when the bulls rule supreme and when bears run amok. When used together, this set of discretionary tools do a respectable job of providing reliable bottom signals, especially when applied in conjunction with trend and channel lines. I call it the sonar trio bottom sounder (STBS). It relies on one solid principle of technical analysis: confirmation. |
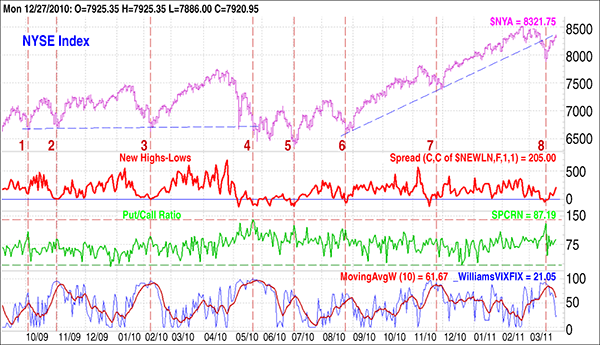
| SONAR TRIO CONSTRUCTION Constructing the sonar trio bottom sounder is a relatively simple exercise. I used Genesis Trade Navigator for my purposes here. Here is the generic formula that should be easy enough to translate into most formula languages used in popular charting software packages: Indicator 1: NYSE New Highs - New Lows |
| Indicator 2: NYSE Put/Call Ratio Most software programs have a symbol for the put/call ratios of the NYSE and/or the NASDAQ. (Genesis Trade Navigator NYSE put/call ratio is $PCRN.) Indicator 3: The Williams VIX FIX VIX FIX = ((Highest 22-day close - low)/(Highest 22-day close)) 100 |
| Add a 10-day weighted moving average of the VIX FIX to smooth it. Now add these three indicators to a chart of the NYSE index. 20/20 HINDSIGHT Bottom 4, 5, and 6 are not as clear. First, the NYSE index appears to have entered a trading range and bottom 4 had the highest VIX FIX reading. We also see clear positive divergence between the NH-NL, PCRN, and the NYSE. But it was not until signal 6 that the bottom had finally been put in and the NYSE rallied in earnest. The last signal (no. 8) occurred on March 16, 2011. It is important to point out that indicator readings can change significantly in different types of markets. For example, at the major bottom on March 9, 2009, NH-NL hit an extremely pessimistic reading of 851. This compares to 131 on May 6, 2010, which is the most pessimistic reading we've seen since then. |
| All three of the STSB indicators can be used independently, but note the difference between this application and their use together. There are times when the NH-NL bottomed, but the absolute readings were very different when a bottom occurred. In the case of the PCRN, price lows sometimes occurred when the put/call peaked, but again, the absolute values varied widely. Using this indicator in isolation would have proven frustrating indeed.
FIGURE 1: NYSE, DAILY. Together with the terrific trio: the NYSE new highs - new lows (red), the NYSE put/call ratio (green) and the Williams VIX FIX indicator (blue). STRENGTH IN NUMBERS It is interesting to note that the S&P 500 emini (ES) advance/decline line is also showing strong positive divergence with ES, according to Larry Williams. It is another confirmation that a bottom of some sort has been put in. If used properly, the STBS should lower the risk of trying to catch a falling knife and thereby reduce the pain and blood-loss in the process!
RELATED REFERENCE |
Matt Blackman is a full-time technical and financial writer and trader. He produces corporate and financial newsletters, and assists clients in getting published in the mainstream media. He tweets about stocks he is watching at www.twitter.com/RatioTrade Matt has earned the Chartered Market Technician (CMT) designation.
| E-mail address: | indextradermb@gmail.com |
PRINT THIS ARTICLE

Request Information From Our Sponsors
- StockCharts.com, Inc.
- Candle Patterns
- Candlestick Charting Explained
- Intermarket Technical Analysis
- John Murphy on Chart Analysis
- John Murphy's Chart Pattern Recognition
- John Murphy's Market Message
- MurphyExplainsMarketAnalysis-Intermarket Analysis
- MurphyExplainsMarketAnalysis-Visual Analysis
- StockCharts.com
- Technical Analysis of the Financial Markets
- The Visual Investor
- VectorVest, Inc.
- Executive Premier Workshop
- One-Day Options Course
- OptionsPro
- Retirement Income Workshop
- Sure-Fire Trading Systems (VectorVest, Inc.)
- Trading as a Business Workshop
- VectorVest 7 EOD
- VectorVest 7 RealTime/IntraDay
- VectorVest AutoTester
- VectorVest Educational Services
- VectorVest OnLine
- VectorVest Options Analyzer
- VectorVest ProGraphics v6.0
- VectorVest ProTrader 7
- VectorVest RealTime Derby Tool
- VectorVest Simulator
- VectorVest Variator
- VectorVest Watchdog

