HOT TOPICS LIST
- Strategies
- Stocks
- Buy
- Investing
- Brokers
- Psychology
- Interviews
- Accumulate
- Sell
- Hold
- Spotlight
- Websites
- Candlestick Corner
- Gold & Metals
- Options Trading
LIST OF TOPICS
TRADER'S NOTEBOOK
Three Fundamental Market Monsters
07/27/11 03:47:48 PM PSTby Matt Blackman
Whatever US lawmakers decide to do to prop up the markets, there will be consequences.
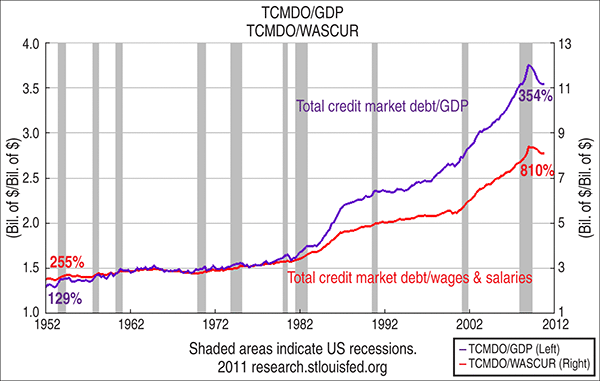
| Even though the next Presidential election is more than a year away, the campaign has been in full swing for months, if President Obama's speech on April 13, 2011, was any indication. It was long on rhetoric but short on details other than the obvious statement that the deficit must come down. And therein lies the rub. While Democrats and Republicans feud about what options are best, whatever road they take has huge implications for the market and our portfolios. Along the way, lawmakers have to confront three monsters of the current market looming in front of them, and they are: MONSTER 1: MOUNTING DEBT
FIGURE 1: MOUNTING DEBT. Quarterly chart comparing the rapid growth of total credit market debt to GDP (purple) and total credit market debt to wages & salaries (red). |
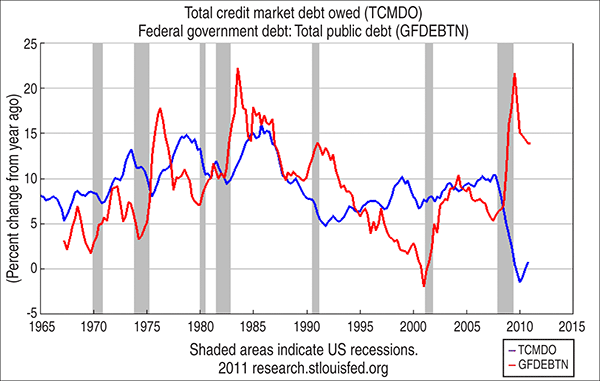
| Stimulus and bailout programs were initiated to deal with the fallout from the most serious financial crisis in more than 80 years, and that effort became known as quantitative easing 1 (QE1). QE1 pumped trillions into financial institutions and the economy as a stop-gap to get things running smoothly. Unfortunately, it did not work as planned, prompting quantitative easing, part 2 (QE2), investing another $600 billion. As Figure 2 shows, while the recession reduced total debt (which is what was supposed to happen), government (public) debt soared. Habits haven't changed, and the net effect is that total debt is again on the rise, as the blue line at the far right side of the chart shows.
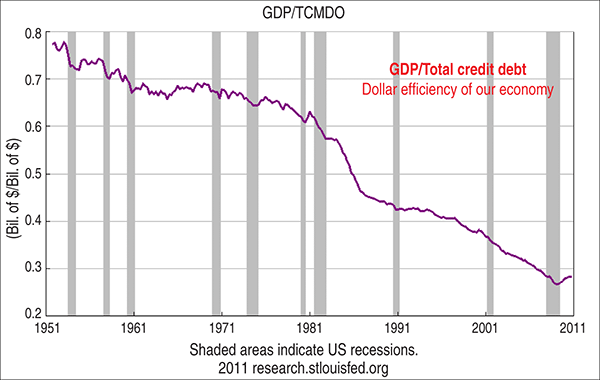
FIGURE 2: SOARING GOVERNMENT DEBT. Chart showing year-over-year rate of change of government (public) debt (red line) to total debt (blue line) showing the huge divergence in growth rates between the two in 2009. It is also interesting to note that in 2009, the divergence in annual growth rates between total debt and government debt was the widest in history when government debt grew at a record 21.6%. That year also marked the first time that total debt declined since the data began to be tracked in 1965. The benefit was that a more devastating financial meltdown was at least temporarily averted. But every benefit has a cost. As Figure 3 shows, it is taking an increasing number of dollars to keep our economy expanding, since debt has been growing far more rapidly than economic output. And we know this boost is now being accomplished by a mass increase of government debt.
FIGURE 3: GDP TO TOTAL DEBT. It takes continually more debt to drive our economy, with the result that our economy is losing dollar efficiency. |
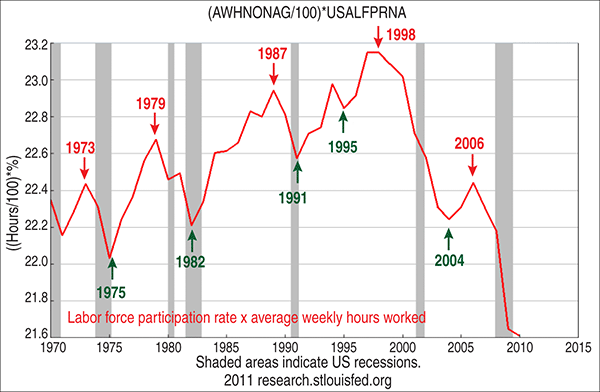
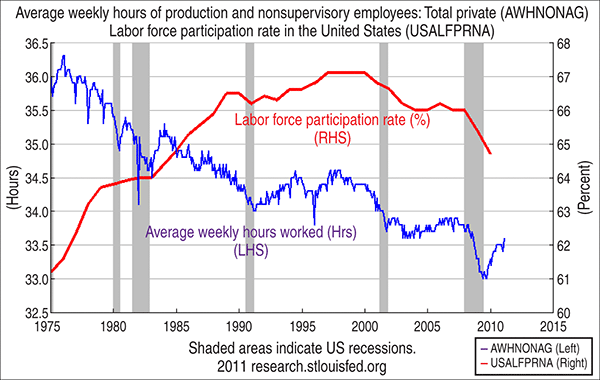 FIGURE 4: MIDDLE-CLASS SLIDE. Here you see that the labor force participation rate (red) and the average weekly hours worked (blue) have both steadily declined over the last decade. The amount of work being performed by the middle class is also declining (Figure 4). And that brings us to our second troubling observation: MONSTER 2: MIDDLE-CLASS SLIDE Multiplying average hours worked times labor force participation rate yielded the results of Figure 5, revealing that average US work force hours peaked in 1998. So the average hours worked by the middle class in the Main Street economy have been falling ever since.
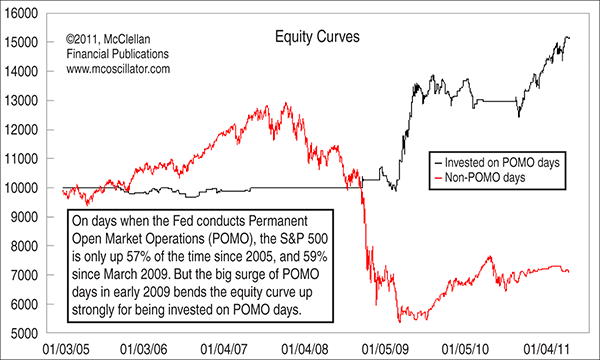
FIGURE 5: ANNUAL LABOR FORCE PARTICIPATION RATE MULTIPLIED BY THE AVERAGE WEEKLY HOURS WORKED BY EMPLOYEES. Note the dates of the peaks and troughs. The latest trough has yet to occur. MONSTER 3: GOVERNMENT (AND FEDERAL RESERVE) BIG DADDY Figure 6 shows how important stimulus has been to markets. In an effort to repair our broken financial system, the government and Federal Reserve took unprecedented action by injecting trillions into the economy, buying toxic assets, taking over Fannie Mae and Freddie Mac, and more. Trillions were made available through various programs, the Fed discount window, and Treasury auctions. As QE2 was winding down, the Fed was now purchasing 70% of US Treasuries, according to bond king Bill Gross of PIMCO. Jobs recovery and the economy may have been slow to respond, but stocks have definitely enjoyed the lift.
FIGURE 6: EFFECT OF STIMULUS. Here you see the difference in stocks on days in which Permanent Open Market Operations didn't pump money into the economy (markets) in red and days when they did (black) between 2005 and 2010. Chart courtesy of www.mcoscillator.com |
| So what will fill the gap now that QE2 is finished? Gross isn't sure but suspects that interest rates must go higher and that won't be good for the economy, stocks, or bonds. SO WHAT NOW? As long as the Fed can keep this massive game of musical chairs going, in nominal terms stocks and commodities should remain strong. Bond yields have been rising, which is no surprise based on comments by Gross and others on the gaping challenges faced by our economic recovery and currency. How quickly rates rise will indicate when the game is coming undone and inflation is rearing its ugly head. Gold and silver prices will offer a clue. But it's not all doom and gloom. In spite of massive government interference, the economy is beginning to show signs of recovery. Total US exports are growing faster than imports, and that is healthy. And the growth of the wealthy class presents opportunities for those who know how to read the signs. With an election approaching, voters will continue to clamor for government help, which means the probability of QE3 is better than 50/50. Gold and silver (and other precious and semiprecious metals) should remain good bets longer term, if the history of fiat paper money is any guide. Stocks should also continue to rally in nominal terms, but the challenge will be how they fare in real inflation-adjusted terms. For more about this, see my article, "The Inflation Story: Separating Fact From Fiction," at Working-Money.com. Picking those stocks that will prosper in an inflationary environment will be key. Given the risks and uncertainties, we traders are lucky. It is much more of a trader's market than it is an investor's - an environment I see remaining for the foreseeable future. And as long as the Fed and the government take active roles, it should continue to be profitable to play along. |
SUGGESTED READING
|
Matt Blackman is a full-time technical and financial writer and trader. He produces corporate and financial newsletters, and assists clients in getting published in the mainstream media. He tweets about stocks he is watching at www.twitter.com/RatioTrade Matt has earned the Chartered Market Technician (CMT) designation.
| E-mail address: | indextradermb@gmail.com |
PRINT THIS ARTICLE

Request Information From Our Sponsors
- VectorVest, Inc.
- Executive Premier Workshop
- One-Day Options Course
- OptionsPro
- Retirement Income Workshop
- Sure-Fire Trading Systems (VectorVest, Inc.)
- Trading as a Business Workshop
- VectorVest 7 EOD
- VectorVest 7 RealTime/IntraDay
- VectorVest AutoTester
- VectorVest Educational Services
- VectorVest OnLine
- VectorVest Options Analyzer
- VectorVest ProGraphics v6.0
- VectorVest ProTrader 7
- VectorVest RealTime Derby Tool
- VectorVest Simulator
- VectorVest Variator
- VectorVest Watchdog
- StockCharts.com, Inc.
- Candle Patterns
- Candlestick Charting Explained
- Intermarket Technical Analysis
- John Murphy on Chart Analysis
- John Murphy's Chart Pattern Recognition
- John Murphy's Market Message
- MurphyExplainsMarketAnalysis-Intermarket Analysis
- MurphyExplainsMarketAnalysis-Visual Analysis
- StockCharts.com
- Technical Analysis of the Financial Markets
- The Visual Investor

