HOT TOPICS LIST
- Strategies
- Stocks
- Buy
- Investing
- Brokers
- Psychology
- Interviews
- Accumulate
- Sell
- Hold
- Spotlight
- Websites
- Candlestick Corner
- Gold & Metals
- Options Trading
LIST OF TOPICS
TRADER'S NOTEBOOK
Could One Stock Provide A Reliable Bubble Meter?
09/07/11 01:21:42 PM PSTby Matt Blackman
In 1989, one stock provided an accurate warning that something was amiss with the Nikkei 225 index. It did so again in 1999, months before the peak in US stocks. Is the most recent peak a warning that should not be ignored?
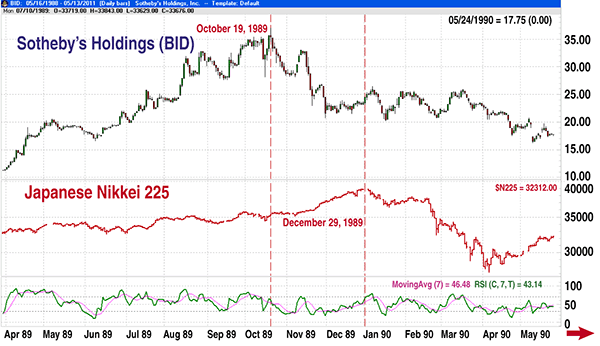
| In Boom, Bustology: Spotting Financial Bubbles Before They Bust, author Vikram Mansharamani examines the history and anatomy of bubbles and busts in financial markets ranging from Tulipmania in the 1600s up to the banking crisis of 2007-08. Like previous books on the subject, Mansharamani's 2011 work is well worth the read if only to reinforce the well-worn quote, "Those who do not learn from the past are doomed to repeat it." "During the 1980s, Japan experienced an extraordinary speculative boom that resulted in a bust that has plagued the island nation for the last 20 years," Mansharamani wrote. And on the last day of the decade, December 29, 1989, the Nikkei 225 index hit its all-time high of 38,957. But assets such as stocks and real estate weren't the only ones to benefit from the 1980s boom. Art enjoyed its fair share as investors and speculators with bloated portfolios bid prices for such pieces as Vincent van Gogh's "Still Life: Vase with Fifteen Sunflowers," which sold at a Christie's auction for an unprecedented $39.9 million to a Japanese buyer in March 1987. It was more than three times the previous record price of $10.4 million for a painting.
FIGURE 1: DAILY CHART OF SOTHEBY'S HOLDINGS (UPPER WINDOW) AND THE NIKKEI 225 (LOWER WINDOW) |
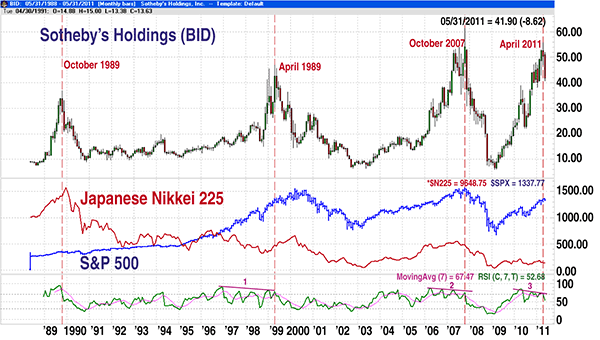
| BUBBLE METER OR COINCIDENCE? Then in May 1990, after the Japanese stock market peak, another Japanese buyer paid $82.5 million for van Gogh's "Portrait of Dr. Gachet," according to Mansharamani. But as the stock of Sotheby's Holdings (BID), which had peaked more than two months ahead of the Nikkei 225 in October 1989, showed, the glory days of Japan's art and stock markets were over. By the time the Nikkei peaked in late December 1989, BID had already lost more than 30%. By April 1990, the Nikkei was down by a similar amount. Was this just a coincidence, or did Sotheby's warn of the impending bubble bust? BID would not peak again for almost another decade, in April 1999. But this time, it wasn't the Japanese wealthy doing the bidding; it was US millionaires and billionaires, many of whom were made wealthy thanks to the Internet bubble. As Figure 2 shows, Sotheby's stock price peaked 11 months before the Standard & Poor's 500 and NASDAQ Composite indexes (see Figure 2). Sotheby's next stock price peak occurred on October 11, 2007, at the same time the S&P 500 was peaking. A little over three weeks later, BID had been cut nearly in half! By the time it hit its next bottom, BID had lost more than 88% compared to a 57% maximum drop for the S&P 500 over a similar period.
FIGURE 2: MONTHLY CHART FROM 1989 THROUGH 2011 SHOWING SOTHEBY'S, THE S&P 500, AND THE NIKKEI 225 |
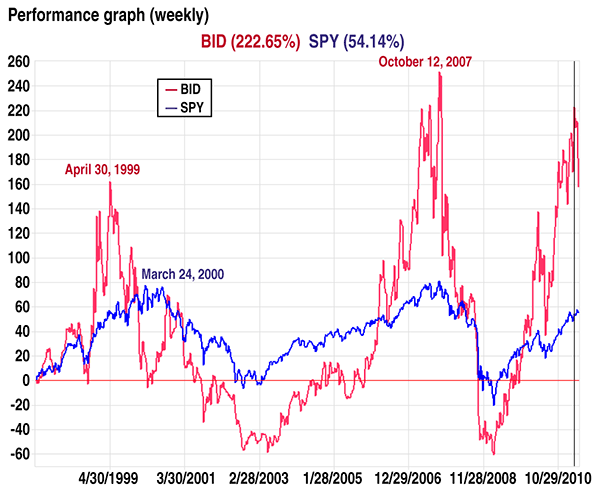
| INDICATOR REVELATION Fast forward to May 12, 2011. In a Bloomberg interview, Vikram Mansharamani warned of a downtrend that was occurring in art prices. He described bidding in recent art auctions as "tepid" and explained why such signs should not be ignored. "Sotheby's stock price going back to 1988 when it went public has been a reasonable proxy for global animal spirits. Anytime you see bubbling art prices, it's usually a sign that we have bubbly conditions somewhere in the world," he said. "After going public, the Japanese art buyers that were setting world record prices led [Sotheby's] stock price up to a new high very quickly and then retrenched." He stated that he believed the May 2011 drop in Sotheby's earnings and drop in stock price were a reflection of a sign that billionaire buyers were retrenching, similar to what occurred with Japanese investors the late 1980s. From a trader's standpoint, the possibility that BID could be a bubble indicator is too tempting not to explore. In two prior stock market peaks, BID rolled over months before the market with one exception, and that was in October 2007. Sometimes it gives lots of warning and at least once, it has been a coincident indicator. But if history is any guide, a significant drop in BID over a short period should not be ignored. We have inserted a short-period relative strength index (RSI), which has provided further confirmation of an impending market top. As we see in Figure 2, the 1999 BID peak was preceded by weakening momentum as shown by the negative divergence between the RSI and stock price (see point 1). The same thing occurred at point 2 when the RSI again demonstrated negative divergence well ahead of the stock price peak. At point 3, observe that the RSI again began diverging negatively with BID nearly a year before the April 2011 peak. In Figure 3, we take a closer look at the performance of BID compared to a proxy for the S&P 500, the S&P 500 SPDR exchange traded fund (ETF) (SPY). From June 1997 to the April 1999 peak, BID jumped 160% versus a gain of less than half that amount by SPY. In 2006-07, BID soared more than 240% versus a much smaller move in SPY. From its last low in early 2009, BID took off again but then quickly dropped 25% by May 13 from its early April peak.
FIGURE 3: WEEKLY PERFORMANCE CHART OF SOTHEBY'S VERSUS THE S&P 500 SPYDER ETF SPY SHOWING PEAKS AND TROUGHS. The last peak in BID occurred on April 5, 2011, when it was up 223% from June 1997 versus a gain of 54% for SPY. By May 13, BID was off 25% from its April 5 peak. |
| BIDDING UP A NEW INDICATOR Just before Boom, Bustology was published, Mansharamani included the most recent BID chart showing the most recent peak in the stock in April 2010 and speculated that the peak was being caused by a bubble driven by Chinese buyers. By early July 2010, BID was off more than 40%. But the drop was short-lived, and the stock price again surged 150% to its April 2011 peak. Readers of his analysis who concluded that US stocks had peaked would have erred if they came to the conclusion that the bull was over. But in fact, the April 2010 BID peak did coincide with a peak - that of the Chinese Shanghai Shenzen Composite index - after which the index dropped 27%. And as of early September 2011, the Shanghai index had still not regained its April 2010 high. What a proper interpretation of BID is trying to tell us requires an understanding of what is driving the art bubble. Only time will tell if the April 2011 BID peak was an indication of an impending top in US stocks or bubbling in another market. But based on the history of BID, it has proved to be a useful indicator of a popping bubble. The nationalities of those who have been most active in buying expensive art are prime suspects. |
| Determine which markets, be it stock, real estate, or commodity, have been assisting buyers to pay exorbitant prices for works of art, and chances are good that you will have found your latest bubble! SUGGESTED READING
|
Matt Blackman is a full-time technical and financial writer and trader. He produces corporate and financial newsletters, and assists clients in getting published in the mainstream media. He tweets about stocks he is watching at www.twitter.com/RatioTrade Matt has earned the Chartered Market Technician (CMT) designation.
| E-mail address: | indextradermb@gmail.com |
PRINT THIS ARTICLE

|

Request Information From Our Sponsors
- StockCharts.com, Inc.
- Candle Patterns
- Candlestick Charting Explained
- Intermarket Technical Analysis
- John Murphy on Chart Analysis
- John Murphy's Chart Pattern Recognition
- John Murphy's Market Message
- MurphyExplainsMarketAnalysis-Intermarket Analysis
- MurphyExplainsMarketAnalysis-Visual Analysis
- StockCharts.com
- Technical Analysis of the Financial Markets
- The Visual Investor
- VectorVest, Inc.
- Executive Premier Workshop
- One-Day Options Course
- OptionsPro
- Retirement Income Workshop
- Sure-Fire Trading Systems (VectorVest, Inc.)
- Trading as a Business Workshop
- VectorVest 7 EOD
- VectorVest 7 RealTime/IntraDay
- VectorVest AutoTester
- VectorVest Educational Services
- VectorVest OnLine
- VectorVest Options Analyzer
- VectorVest ProGraphics v6.0
- VectorVest ProTrader 7
- VectorVest RealTime Derby Tool
- VectorVest Simulator
- VectorVest Variator
- VectorVest Watchdog


