HOT TOPICS LIST
- Strategies
- Stocks
- Buy
- Investing
- Brokers
- Psychology
- Interviews
- Accumulate
- Sell
- Hold
- Spotlight
- Websites
- Candlestick Corner
- Gold & Metals
- Options Trading
LIST OF TOPICS
INVESTING
Internet For Investors
01/26/01 12:05:49 PM PSTby Dennis D. Peterson
Education, analysis, commentary -- you'll find it all on the Internet. Here's a sample of the top websites for investing information.
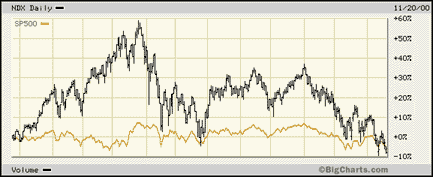
| Looking for information on investing? The Internet offers a wealth of resources, all just a mouse-click away. The challenge comes in sifting through the myriad offerings to find information that is accurate and easy to understand and exactly what you're looking for. Information is a valuable commodity. This is especially true for investing, because quality information can mean the difference between financial achievements and expensive mistakes. When I first started searching the web for investment information, I found a few excellent sites with a lot of educational content, and many others with less information that simply repeated others. One general rule I learned early on was that if the business of the site is just to provide information rather than sell investment products, then that site will be one that is worth bookmarking. Perhaps the Internet's most powerful asset is the timeliness of the information it provides. Investors who supplement that information with a classic book or two about investing will profit even more. Following are just a few topics you may need information about, and some suggestions on where to find them. The complete list of website addresses of places I've mentioned may be found in the sidebars at the bottom of this article. INVESTING BASICS What is investing all about? What is the best approach to asset allocation? Come to think of it, what is asset allocation? For answers to these questions and more, look for sites that explain investing in layman's terms, such as The Motley Fool (www.fool.com), Microsoft Money Central (moneycentral.msn.com/investor), and Smart Money (university.smartmoney.com). Also worth mentioning is www.401k.com, where you will find 401(k) investing advice from Fidelity Investments, one of the largest mutual fund families in the world. For information about mutual funds, consider Mutual Fund Education Alliance (www.mfea.com). Once you've gotten your feet wet in the information possibilities, go to the Securities and Exchange Commission site (www.sec.gov). The site is designed for the beginner, and the information it provides is easy to understand and enlightening. For those who have a little more knowledge but want more, try the archives of the Federal Reserve Board (www.federalreserve.gov). GLOSSARIES Say you've done some reading, but you find a term you don't understand, or maybe you just can't remember the definition. There are a number of sites you can turn to for help with investment terminology, including Yahoo! Finance (finance.yahoo.com), Investopedia (investopedia.com), Nasdaq (nasdaq.com), the New York Stock Exchange (www.nyse.com), Money Central, and The Motley Fool. MARKET AND SECTOR PERFORMANCE After you have a good grasp of the basics, your next question might be: How are the various markets and market sectors doing? Yahoo! Finance's market summary page shows the performance of the market indices. Are you wondering what stocks make up the indices? The Nasdaq site has Nasdaq-related sector indices and all the stocks that compose them. You can also find market index stock breakdowns at Stockscores (www.stockscores.com), as well as breakdowns for several sectors. Stockscores covers Canadian indices as well. You can compare how various markets are doing on a variety of sites. One of the best is BigCharts (www.bigcharts.com). If you are interested in the top 100 Nasdaq stocks by market capitalization (NDX) compared to, say, the Standard & Poor's 500 (Figure 1), visit the Standard & Poor's website (www.standardandpoors.com). For an alphabetical list of the stocks that make up the S&P 500, see www.spglobal.com/500mainframe.html.
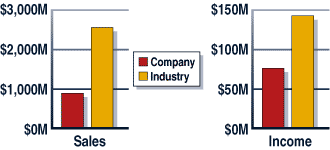
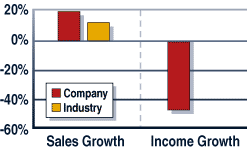
You want to know about market breadth? Market breadth is a measure of how many stocks are participating in an advancing or declining market. It's part of knowing whether the market is bullish or bearish -- something you should be aware of before you make any investment decisions. The typical measures of market breadth are the number of stocks making 52-week highs or lows, the number of stocks advancing and declining, and the amount of up volume and down volume. Yahoo! Finance provides this information, but there is more to market breadth. In-depth analysis is available at MarketGauge (www.marketgauge.com), which also provides performance information on market sectors and subsectors. ANALYSIS I like to break investment information into two broad categories: data that supports fundamental analysis and data that supports technical analysis. Fundamental analysis is the balance sheet for a company, such as earnings, cash flow, debt, and growth rate. Technical analysis uses price and volume history to see if a pattern or trend has developed that can give insight into where a stock or market is headed. As you might have guessed, you can find useful websites on both these topics. Fundamental The best sites for fundamental data are Yahoo! Finance and Money Central (Figure 2). Each site provides a different slant on fundamental data. The Motley Fool also deserves recognition because it focuses on education.
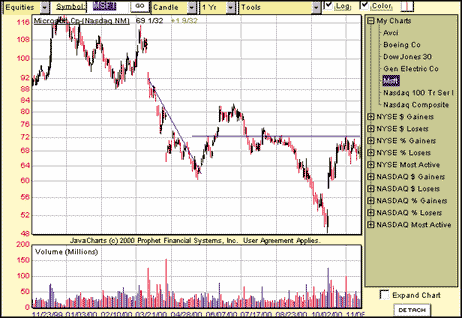
Is the fundamental data presented by these sites the last word? Of course not. The National Association of Investors Corporation (NAIC) (www.better-investing.org) prefers Value Line or Standard & Poor's data. Did you know that conference calls with analysts are recorded? Vcall (www.vcall.com) lists numerous conference calls about to take place and archives previous such calls. You can listen in live or play back previous calls. Technical For a definition of patterns, see www.stockcharts.com. Other than that, you'll need to go to the library or buy a book to understand patterns, because there isn't much on the Internet about patterns. There's very little discussion, with one exception: Gary B. Smith is an unabashed technical analyst who writes for www.thestreet.com. The Internet does offer some trendline drawing assistance, but gets its best marks when it comes to indicators. BigCharts offers a robust list of indicators, allows the user to choose time frames, lists the most active stocks in terms of volume and price, and more. BigCharts is sponsored by Cbs MarketWatch, which I will look into later. To add trendlines to a chart, try Prophet Finance (www.prophetfinance.com). Prophet Finance (Figure 3) also provides an assortment of indicators. However, you'll need skill and practice to know when to use them. StockCharts.com can help in that regard.
STOCK SCREENING For fundamental analysis screening, Money Central is one of the best. For technical analysis screening, Stockscores.com offers some unique features. Stockscores uses some proprietary techniques but also offers some traditional methods. If you want to look for patterns, Prophet Finance offers a solution. Using "Chart Surfer" you can select, for example, technology, then telecommunication, then wireless communication, and then scroll through the 22 charts that appear. NEWS AND COMMENTARY The Internet excels in providing timely news and comment. One of the best in terms of short and sweet is CBS MarketWatch (www.cbs.marketwatch.com). Try both MarketWatch and BigCharts sites. Yahoo! Finance is very good in terms of news as well. One thing you have to get used to if you're a short-term investor is that it's not your opinion that's important, it's the analysts' opinions. Knowing the opinions of others can be beneficial. The site that is unique for commentary is TheStreet.com. You'll see references to it in many places. You can get opinions on just about everything financial on TheStreet.com; not only that, the article archive is impressive. If you want to do two things at once -- and who doesn't? -- then go to Bloomberg (www.bloomberg.com) and watch its broadcast live. You'll need to install a video player, but you can usually download one for free. STOCK QUOTES The Internet provides the current price for a stock or market index with a 20-minute delay. You can even get your pager to warn you if a stock hits a certain level. For a fee, you can get real-time streaming quotes. With real-time streaming quotes, you can build a list of stocks and watch their prices change automatically in real time. Why would you want to see quotes immediately? The battle between the bulls and the bears is continuous and tempestuous; if you are looking to time a trade, ignoring the last 20 minutes of the trading session in particular could be expensive and detrimental to your portfolio. A number of companies offer real-time data on the Internet. When you get to this type of investing, you should start thinking about cable modems or a digital subscriber line (DSL). End-of-day price and volume data is available for download through several sources for use with software packages, for a fee. Occasionally, you'll find packages that use free Yahoo! Finance data (see E-ZPnf at www.ez-pnf.com). The software packages provide for a range of analysis capabilities, most of which are geared for technical analysis. For delayed quotes, Yahoo! Finance works, as well as a number of others. It is possible to see some real-time data for free. A number of sites offer a free real-time quote for a single stock. One site, however, is more robust -- www.islandbook.com. Island trades Nasdaq as well as small-cap stocks. SUMMARY There is no substitute for reading on your own or joining an investment club. The Internet's biggest asset is its timeliness. Two robust sites are Money Central and Yahoo! Finance, but they are missing features you may need. Both The Motley Fool and Money Central make an effort to educate the investor. MarketGauge provides clear explanations of market breadth, and TheStreet.com, because of its extensive article archive, does as well. Almost all of the sites mentioned provide information about stocks and mutual funds. And there's a bunch of unique information at MarketWatch. The complex subject of options is another topic altogether. Both the Chicago Board Options Exchange, www.cboe.com, and the Chicago Mercantile Exchange, www.cme.com, offer information about options and futures, and both are excellent sites. If you don't know what a pit is or what implied volatility is, then do a lot of reading before you dive into either area.
INTERNET KNOCKOUTS I have summarized the heavy hitters in this table. The key is: Yes = Above average, OK = Some information, Excellent = Top Internet performer, No = Not available, -- = Very little information.
|
Market index trading on a daily basis.
| Title: | Staff Writer |
| Company: | Technical Analysis, Inc. |
| Address: | 4757 California Ave SW |
| Seattle, WA 98116-4499 | |
| Phone # for sales: | 206 938 0570 |
| Fax: | 206 938 1307 |
| Website: | working-money.com |
| E-mail address: | dpeterson@traders.com |
Traders' Resource Links | |
| Charting the Stock Market: The Wyckoff Method -- Books | |
| Working-Money.com -- Online Trading Services | |
| Traders.com Advantage -- Online Trading Services | |
| Technical Analysis of Stocks & Commodities -- Publications and Newsletters | |
| Working Money, at Working-Money.com -- Publications and Newsletters | |
| Traders.com Advantage -- Publications and Newsletters | |
| Professional Traders Starter Kit -- Software | |
PRINT THIS ARTICLE

Request Information From Our Sponsors
- VectorVest, Inc.
- Executive Premier Workshop
- One-Day Options Course
- OptionsPro
- Retirement Income Workshop
- Sure-Fire Trading Systems (VectorVest, Inc.)
- Trading as a Business Workshop
- VectorVest 7 EOD
- VectorVest 7 RealTime/IntraDay
- VectorVest AutoTester
- VectorVest Educational Services
- VectorVest OnLine
- VectorVest Options Analyzer
- VectorVest ProGraphics v6.0
- VectorVest ProTrader 7
- VectorVest RealTime Derby Tool
- VectorVest Simulator
- VectorVest Variator
- VectorVest Watchdog
- StockCharts.com, Inc.
- Candle Patterns
- Candlestick Charting Explained
- Intermarket Technical Analysis
- John Murphy on Chart Analysis
- John Murphy's Chart Pattern Recognition
- John Murphy's Market Message
- MurphyExplainsMarketAnalysis-Intermarket Analysis
- MurphyExplainsMarketAnalysis-Visual Analysis
- StockCharts.com
- Technical Analysis of the Financial Markets
- The Visual Investor


