HOT TOPICS LIST
- Strategies
- Stocks
- Buy
- Investing
- Brokers
- Psychology
- Interviews
- Accumulate
- Sell
- Hold
- Spotlight
- Websites
- Candlestick Corner
- Gold & Metals
- Options Trading
LIST OF TOPICS
TRADER'S NOTEBOOK
Find The Biggest Winners
12/20/11 10:02:22 AM PSTby Mike Carr, CMT and Amber Hestla-Barnhart
Studying the winners of the past 10 years can give you an idea of the possible winners of the next five.
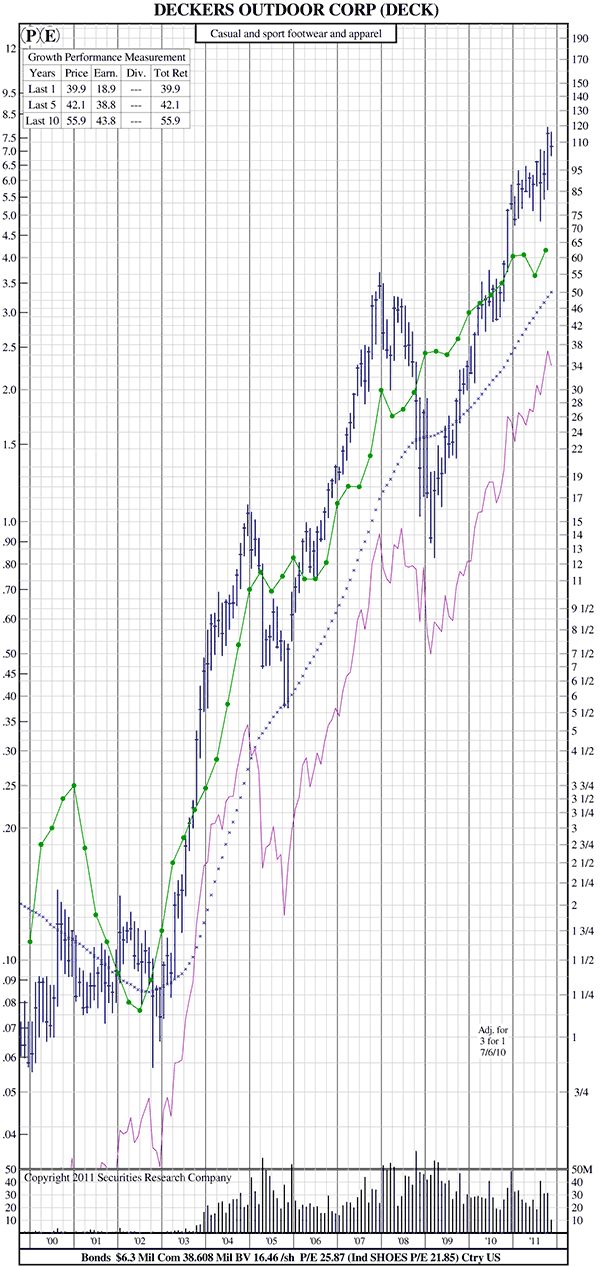
| Over the long term, stocks deliver average annual gains of 7% to 10% a year, but traders want much more than that. Studying the biggest winners of the past can offer clues on how to find the biggest winners of the next five years. We'll start with the bad news, in that making big money in stocks can mean trading infrequently. Traders often like to move in and out of stocks quickly, and it is possible to make a living from active trading styles. But the news for traders is that the biggest gains in the stock market will probably come from doing the least. Edwin LeFévre explained this in the classic Reminiscences Of A Stock Operator, when he said: "After spending many years in Wall Street and after making and losing millions of dollars I want to tell you this: It never was my thinking that made the big money for me. It always was my sitting. Got that? My sitting tight!" SITTING TIGHT
FIGURE 1: SITTING TIGHT. This long-term chart of DECK shows the value of a buy & hold strategy. Over the past 10 years, DECK has delivered an annual average return of 55.9%, doubling your money about every 15 months. Earnings growth as well as price gains and the earnings for DECK have compounded at an average of 43.8% over the past decade. The stock price has remained above its 48-month moving average for most of the past 10 years. |
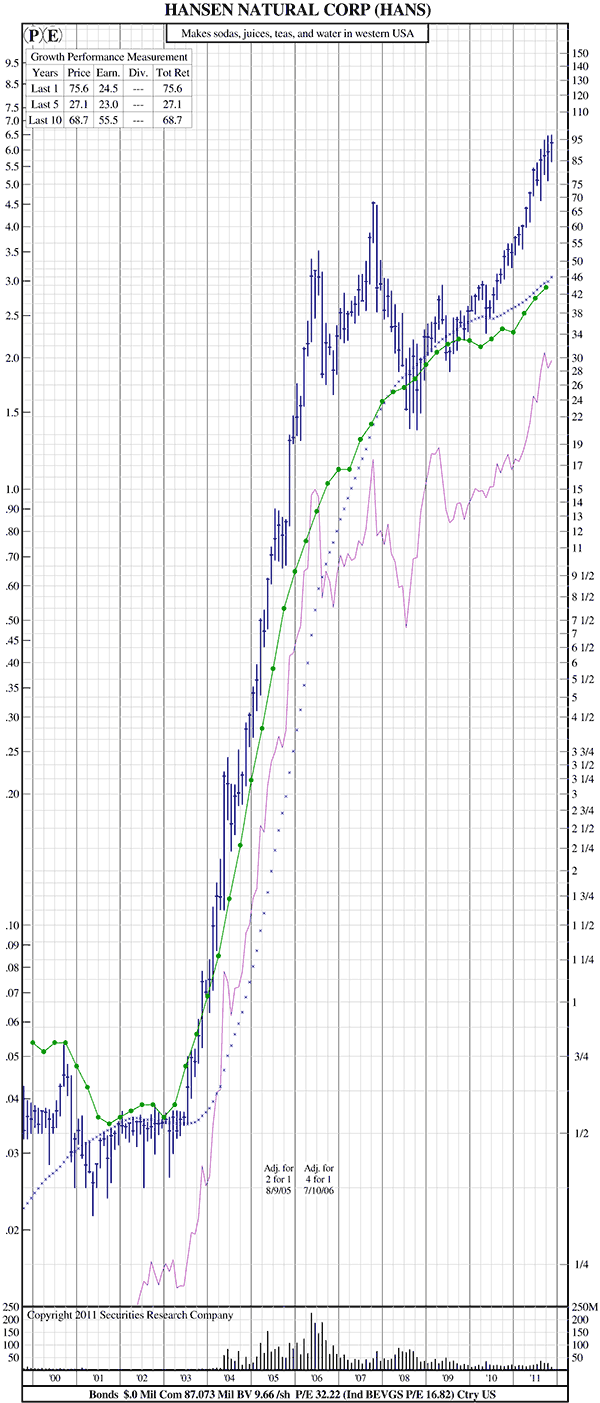
| Another long-term winner has been Hansen's Natural (HANS). Figure 2 shows the same pattern of a sustained uptrend in both price and earnings. The stock has appreciated by an average of 68.7% a year over the past 10 years, while earnings have grown by 55.5% a year over that time.
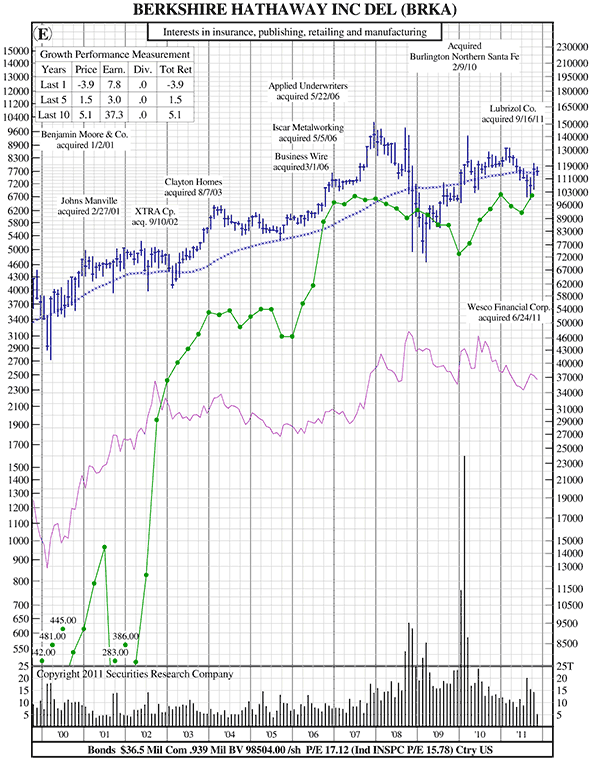
FIGURE 2: BIG WINNER. HANS has been the biggest stock market winner over the past 10 years. You see the same pattern of a sustained uptrend in both price and earnings. The stock has appreciated by an average of 68.7% a year over the past 10 years, while earnings have grown by 55.5% a year over that time. HANS again shows the value of following a long-term moving average. Like DECK, the big price rise follows a breakout from a base. Also like DECK, the earnings growth in HANS has been as strong and sustained as the stock price gains. Earnings growth alone, however, is not a sufficient characteristic to identify the biggest stock market winners. Berkshire Hathaway (BRK) has delivered outstanding long-term gains to investors and has grown earnings that are well above the market average (Figure 3). However, over the past 10 years, the stock price has gained an average of only 5.1% a year, far below the earnings growth rate of 37.3% a year over that time. Past performance is not a guarantee of future returns, and we can see that in BRK. However, past returns are all we can study to learn about what should work in the future.
FIGURE 3: ANOTHER WINNER. BRK is one of the greatest stocks over the past 30 years but has not come close to the gains of HANS or DECK over the past 10 years. TECHNICALS AND FUNDAMENTALS |
| Technicians may not want to study fundamentals but as we can see with DECK and HANS, earnings and price gains tend to show a strong correlation over the long term. Almost any trader would be happy with the returns in those two stocks, but few would have found them and held them for 10 years to realize the possible returns. In looking at these stocks, we can learn that valuation matters, another idea that technicians may not be happy with. HANS had an average price/earnings ratio of about 24 over the time it delivered big gains. DECK had even bigger gains but an even lower P/E ratio of about 16. BRK was in the middle with a P/E ratio of about 19. Again, this highlights the fact that earnings are not enough to deliver big gains. Look at the chart and buy stocks with high RS and good earnings. The level of the P/E ratio seems less important than the fact that there is a P/E ratio. Long-term winners need to have earnings. Many big winners in the Internet bubble lacked earnings and the stock prices eventually fell back down. Size also seems to be an important factor in finding winners. Small stocks can generally grow faster than large stocks. Berkshire Hathaway is an exception because of Warren Buffet's unique genius. Apple is another exception, but large-cap companies are usually widely followed and they are unlikely to deliver the kind of earnings growth that a small company can have. Traders hunting for these big gainers, the kind of stocks Peter Lynch described as 10-baggers, could start by screening for small-cap stocks with earnings growth. Specific criteria could be a market cap below $300 million, and more trading candidates can be found by setting the cutoff to a higher number. The next step would be to require that the company have positive earnings for at least four years. This will eliminate many low-quality companies. An earnings requirement will screen for long-term winners and will not catch short-term fad stocks. A longer-term technical signal like the 48-month moving average would be helpful. Applying this simple strategy to the stocks that make up the small-cap Russell 2000 index shows a return of about 6% a year over the past 35 years but would require an account size of more than $1 million because of the large number of positions required. Adding an earnings filter to the trading system boosts the average annual return to more than 10% over the past 25 years (less fundamental data is available from most data providers). An account size of more than $1 million is still needed, but the improvement in performance demonstrates the value of combining fundamental data with a technical strategy in pursuit of the big winners. |
| Weekly signals can also be used to trade when the idea is to hold for the longest time possible. The moving average convergence/divergence (MACD) is an indicator that often tests well. It has clear signals, buying when the indicator rises above zero and selling when MACD turns negative. Other indicators can, of course, be used in a trading strategy, but they usually need some degree of optimization, while MACD is often profitable with the default values. In this test, the default values on weekly data for the Russell 2000 stocks are used. With a simple MACD long-only strategy, the returns average more than 7% a year for the full test period. Traders would be in the market less than half the time and uninvested cash could earn additional returns in money market instruments. The earnings filter can also be applied to MACD and the average return would be about 9% a year while being invested only a third of the time. FINDING THOSE WINNERS There is no way to find the exact stock that will be the biggest winner in the next five years. A simple strategy can increase the odds of winning, and combining technicals and fundamentals may be the best strategy in the hunt for 10-baggers. |
Mike Carr is a member of the Market Technicians Association and editor of the MTA's newsletter, Technically Speaking, and author of two investment books. He is a full-time trader and writer. Amber Hestla-Barnhart is an independent market researcher. She is a frequent contributor to financial publications in the US and Great Britain, and her work has previously been featured in Technical Analysis of STOCKS & COMMODITIES.
PRINT THIS ARTICLE

Request Information From Our Sponsors
- StockCharts.com, Inc.
- Candle Patterns
- Candlestick Charting Explained
- Intermarket Technical Analysis
- John Murphy on Chart Analysis
- John Murphy's Chart Pattern Recognition
- John Murphy's Market Message
- MurphyExplainsMarketAnalysis-Intermarket Analysis
- MurphyExplainsMarketAnalysis-Visual Analysis
- StockCharts.com
- Technical Analysis of the Financial Markets
- The Visual Investor
- VectorVest, Inc.
- Executive Premier Workshop
- One-Day Options Course
- OptionsPro
- Retirement Income Workshop
- Sure-Fire Trading Systems (VectorVest, Inc.)
- Trading as a Business Workshop
- VectorVest 7 EOD
- VectorVest 7 RealTime/IntraDay
- VectorVest AutoTester
- VectorVest Educational Services
- VectorVest OnLine
- VectorVest Options Analyzer
- VectorVest ProGraphics v6.0
- VectorVest ProTrader 7
- VectorVest RealTime Derby Tool
- VectorVest Simulator
- VectorVest Variator
- VectorVest Watchdog


