HOT TOPICS LIST
- Strategies
- Stocks
- Buy
- Investing
- Brokers
- Psychology
- Interviews
- Accumulate
- Sell
- Hold
- Spotlight
- Websites
- Candlestick Corner
- Gold & Metals
- Options Trading
LIST OF TOPICS
TRADER'S NOTEBOOK
Mutual Fund Timing: Lessons From The Past
04/02/12 11:42:10 AM PSTby Alan Peiris and Kay Peiris
Timing the stock market need not be a complex task. Nor should the market timing of mutual funds.
| In the 1990s there was an opportunity to time entries and exits into mutual funds with the potential to capture large profits and endure only minimal drawdowns. In this article, we will explore some of the simple tools that have been used to time the market. Attention is turning more and more to market timing of mutual funds, which were deemed for long-term buy & hold investors. Moreover, with illegal after-hours trading and a dramatic increase in mutual fund timing, restrictive practices to limit mutual fund timing were implemented. Ironically, during the collapse of these high-volatility funds, with declines ranging from 60% to 85% in 2000-02, the proposed model discussed here would have still been marginally profitable. The last decade has been essentially flat in terms of stock market return. The timing of mutual funds has decreased substantially following the documentation of frequent trading as well as illegal late trading. Many large mutual funds have severely clamped down on moving dollars between funds, essentially locking an investor into a long-term buy & hold mode. There are many advocates of this approach. However, those investors who adopted it and fully invested in the stock market around March 2000 took a beating, with losses often exceeding 60% to 70%. It has been in the interests of many mutual funds to limit exchanges between funds, since it contains costs. But is it in the best interest of investors? Should investors be locked into very long holding periods, given that many large funds such as ING, holding billions of dollars in retirement assets, were on the verge of going belly-up prior to the government bailout? The fundamental tenet of any timing technique is to find a repeatable opportunity in terms of entry and exit that allows a reasonable chance of profit while limiting market exposure and then exploit this to provide an acceptable return with reduced risk. Perhaps the best example of a successful mutual fund timer was fund manager Gil Blake. Of his "futures-type" market returns -- about 45% with a minimal drawdown, for example -- 3% has been well documented by analyst and author Jack Schwager. Similar mutual fund timing exploits by investor Steve Lescarbeau have also been documented by Schwager. |
| Here we explore some of the potential concepts that may have been used by mutual fund timers to produce consistent returns often in excess of 30% per year. However, this restriction of traditional mutual fund timing has resulted in the proliferation of a number of funds that permit timing in recent years with such groups as Profunds and Rydex providing both nonleveraged and leveraged funds. The ability to use inverse funds also enables an investor to short the market while being long the fund. Here's how mutual fund timers may have made a fortune in the 1990s with a simple robust model. METHODS Given the upward bias of the stock market, this would be a long-only system. In general, we want to choose a mutual fund that has built in volatility to take advantages of prospective moves. We used Invesco Technology (FTCHX) to develop our model and then test it on another high-beta fund, T. Rowe Price Science and Technology (PRSCX). The mutual fund data was downloaded from Yahoo. RULES The following code was developed for the Behold testing platform: If close > close[1] then buy today at close; There would be a certain amount of estimation involved since the trade would have to be placed before 4 pm Eastern time. A fair estimation of the closing price could be made at about 3:55 pm, either by looking at the fund's largest holdings or a major correlated index. The model returns were tested on a percent basis. |
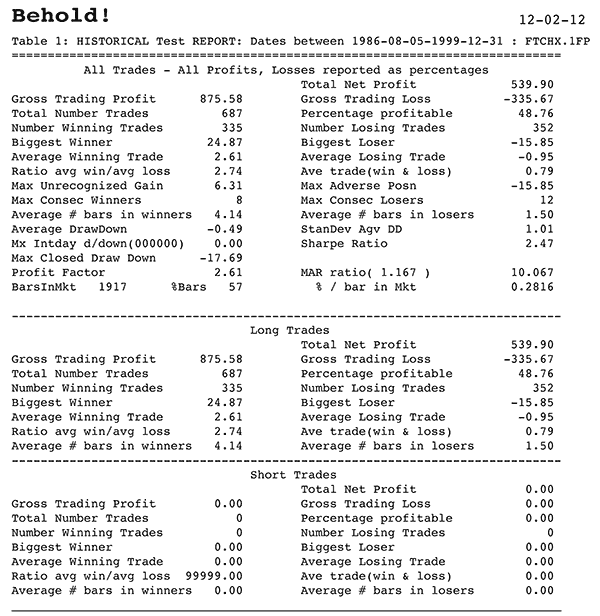
| RESULTS Using that simple two-line code, we will examine the performance of the model on Invesco Technology (FTCHX) for two periods, from 1986 to 1999 and from 2000 to 2012. Behold was set to test as a percentage. As you can see in Figure 1, the model was impressive, producing a total of almost 700 trades -- about 49% profitable, a profit factor of 2.6, and a maximum drawdown of about 18%. A fine system indeed!
FIGURE 1: TEST RESULTS FOR FTCHX (1986-99). There were around 700 trades with about 49% profitable, a profit factor of 2.6, and a maximum drawdown of about 18%.
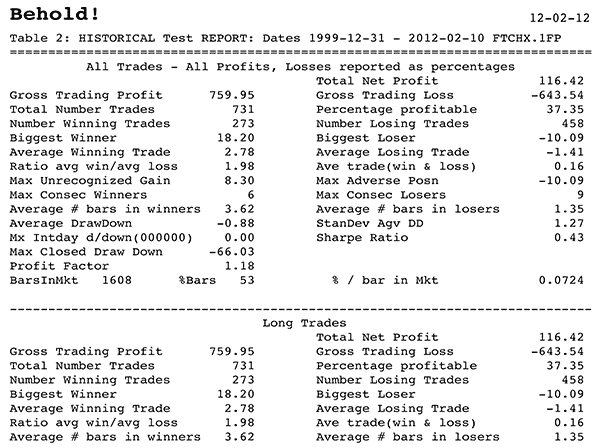
However, take a look at the result from Figure 2, which indicates its performance has drastically diminished 37% profitability, profit factor of 1.2, and a drawdown that has increased to 66%.
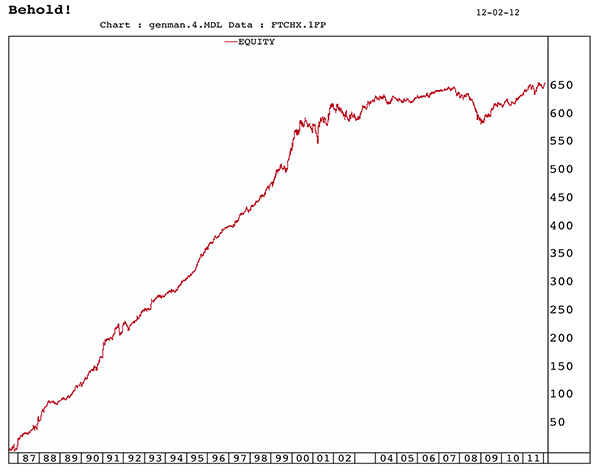
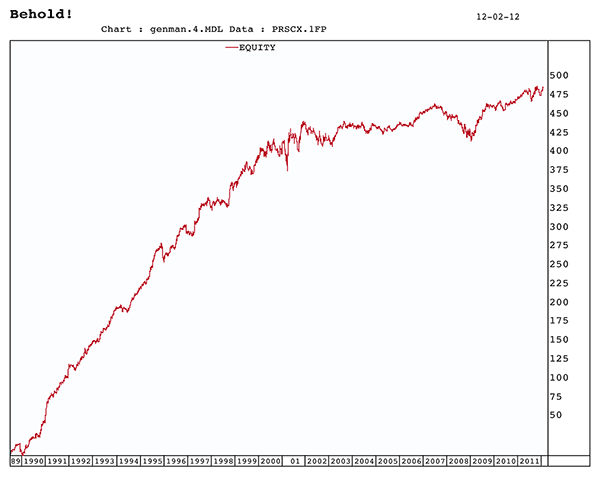
FIGURE 2: TEST RESULTS FOR FTCHX (1999 to 2/12/2012). The performance dwindled to 37% profitability, a profit factor of 1.2, and a drawdown of 66%. The combined equity curve for FTCHX for both periods also highlights the break in the linear uptrend starting around 2001, as shown in Figure 3. The equity curve is very similar for PRSCX (Figure 4).
FIGURE 3: EQUITY CURVE FOR FTCHX (1986 to 2/12/2012). Note that in 2001, there was a break in the linear uptrend.
FIGURE 4: EQUITY CURVE FOR PRSCX (1986 to 2/12/2012). The equity curve is similar to that of FTCHX. CONCLUSION |
| Second, the model explains that it would have been possible to make about 30% per year timing mutual funds with entry and exit before market close. It is a key reminder to would-be traders to keep models simple and robust. The model worked effectively on PRSCX until about the same time, about 2000. What caused the model to regress and become nonviable for trading these two funds? There are likely several reasons. The practice was becoming more prevalent and some large funds were indulging in this practice as well as doing illegal after-hours trading. More and more mutual funds started putting barriers to mutual fund timing that were increasingly difficult to overcome. While not everyone will agree with the concept of timing mutual funds, we can all learn from a system that was elegant and highly profitable for over 13 years. SUGGESTED READING
This article is dedicated to Gil Blake and Steve Lescarbeau for reminding the trading world that a simple robust approach is the key to profits. |
Alan Peiris and Kay Peiris are independent traders and investors who favor a system-based philosophy and trade stocks, options, and futures. They may be reached at Kayay@embarqmail.com.
| E-mail address: | Kayay@embarqmail.com |
PRINT THIS ARTICLE

Request Information From Our Sponsors
- StockCharts.com, Inc.
- Candle Patterns
- Candlestick Charting Explained
- Intermarket Technical Analysis
- John Murphy on Chart Analysis
- John Murphy's Chart Pattern Recognition
- John Murphy's Market Message
- MurphyExplainsMarketAnalysis-Intermarket Analysis
- MurphyExplainsMarketAnalysis-Visual Analysis
- StockCharts.com
- Technical Analysis of the Financial Markets
- The Visual Investor
- VectorVest, Inc.
- Executive Premier Workshop
- One-Day Options Course
- OptionsPro
- Retirement Income Workshop
- Sure-Fire Trading Systems (VectorVest, Inc.)
- Trading as a Business Workshop
- VectorVest 7 EOD
- VectorVest 7 RealTime/IntraDay
- VectorVest AutoTester
- VectorVest Educational Services
- VectorVest OnLine
- VectorVest Options Analyzer
- VectorVest ProGraphics v6.0
- VectorVest ProTrader 7
- VectorVest RealTime Derby Tool
- VectorVest Simulator
- VectorVest Variator
- VectorVest Watchdog


