HOT TOPICS LIST
- Strategies
- Stocks
- Buy
- Investing
- Brokers
- Psychology
- Interviews
- Accumulate
- Sell
- Hold
- Spotlight
- Websites
- Candlestick Corner
- Gold & Metals
- Options Trading
LIST OF TOPICS
TRADER'S NOTEBOOK
Analyzing A Stock With Fundamentals
02/09/17 02:46:21 PM PSTby Koos van der Merwe
What do the fundamentals say about stocks?
| You have identified a stock using technical analysis. You like what you see, but you would like to know more, so you go to your computer, call up the company, and read what the analysts are saying. However, you would like to do your own analysis -- not that you don't trust what you read, but there are conflicting opinions. WHAT THE MEDIA SAYS Analysts tell you that a stock is undervalued if its price/earnings ratio (P/E) is less than twice its growth rate, or they tell you to sell when the multiple is twice its growth rate, but you feel that what your charts tell you is far more conclusive. You ask yourself, what is the best way to check a CEO's performance? Is it by looking at earnings per share growth, or return on capital? Does an increase in a CEO's pay packet suggest that the good times are back, or is it purely greed? Is greed then in itself possibly an indicator? FUNDAMENTALLY SPEAKING Fundamental analysis terms look impressive and again you would like to learn more. Visiting a bookstore, you decide to buy a book with a title like Guide To Fundamental Analysis For Idiots And Dummies. You read it, but you become even more confused. You decide that you do not have an accounting mentality. You are a chartist and have made good stock trading decisions based purely on technical analysis, but that nagging feeling is still there. You would like to know more about a company before buying it. |
| With your daytrading, you have accumulated a great deal of cash. Rather than trade with all of it, you would like to place some into a long-term investment portfolio in preparation for retirement. The golf course is looking more and more appealing. You decide there must be some sort of guide to help you decide what would be a good company to invest in for the long term. In today's world, where derivatives, hedge funds, exchange traded funds (ETFs), and the balance sheets of banks can be very complicated, you would like to know more. With the recent market meltdown, caused mainly by banks that doctored investments to look attractive to investors using money that you entrusted to them for safekeeping, you have learned, at great financial loss, that you can no longer trust what you thought was a safe institution. Fundamentals reported by your bank are no longer that open, so they are not that easy to understand. Whether or not under pressure, accountants at banks and any company experiencing financial difficulties -- Enron Corp. comes quickly to mind -- somehow even today seem to prepare highly confusing financial statements. At least to you they are confusing. Over the years, I have thrown out the complicated balance sheets that we spend hours over not knowing whether our final analysis is correct. I am always looking for simplicity. I am an Elliottician and those of you who follow my Elliott wave analysis will always remember the first rule in Elliott wave theory: the chart must look correct. There must be a simple wave count, not a complicated one. To invest for the long term, we should look for stocks using fundamentals. Once found, we wait for the technicals to trigger a buy signal. With this in mind, I spent many hours talking to researchers at the stockbrokers I worked for many years ago. Over time, I developed a system to analyze a company fundamentally. For the past 20 years, I have been satisfied with the results. Are there better forms of fundamental analysis out there? I am sure there are, but most are too complicated for me. I also don't have the time to spend hours looking over a balance sheet. I am a trader and all I want to do is compare company X with company Y fundamentally as quickly and effectively as possible. |
So I created a spreadsheet I call ANALY, short for "analysis." When I look at the balance sheet of a company, this is what I look for:
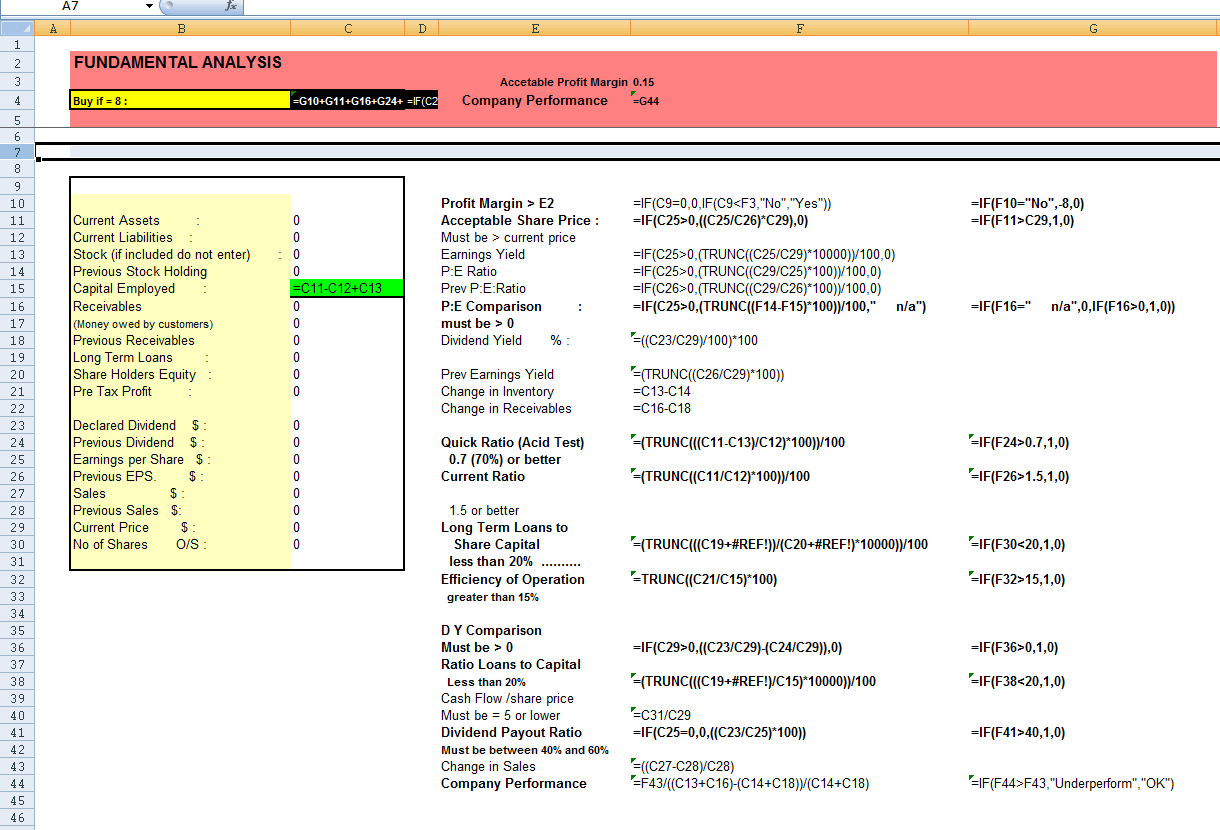
In Figure 1, you see a copy of my spreadsheet showing the input chart and the formulas. Note in the yellow box I have written the words "Buy if = 8." Over the years, I have developed my analysis as follows:
FIGURE 1: INPUT CHART WITH FORMULAS. In the yellow box, you will see the words "Buy if = 8." If the box shows a 5, then watch the share for a future buy. If the box shows a 6, then buy. If the box shows a 7, mortgage your house and buy. Finally, if the box shows an 8, mortgage your house, sell your car, golf clubs, partner, and buy! In all my years of using this strategy and analyzing many companies, I have had only one 8. This happened when I worked as an analyst for a South African broker. In South Africa, clients belong to the brokerage house and brokers work for and are paid by the brokerage house with a bonus incentive performance. Every morning, one hour before the market opens, there would be a meeting where analysts in the company reported to brokers suggesting stocks that could be bought and why. |
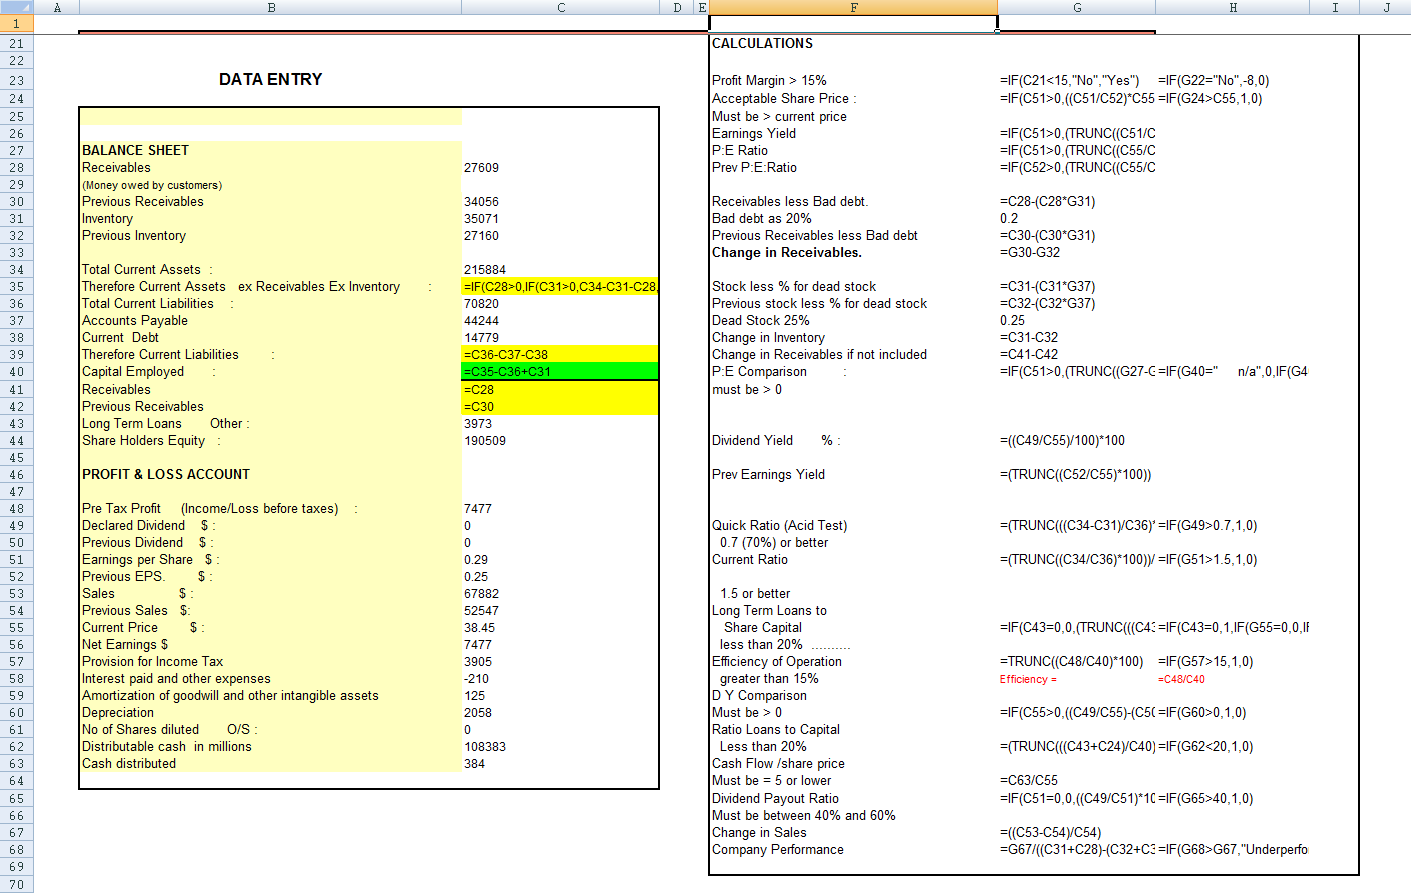
| One morning I issued a report to the brokers in the company that my fundamental analysis suggested a particular share should be bought, a buy signal confirmed by technical analysis. Brokers at the meeting bought heavily into the stock, which caused me to be investigated by the South African securities commission for insider trading after the stock issued a perfect financial report and the share price rose by more than 50%. As you get used to this system, you may decide to add additional figures to the spreadsheet, but that is a decision you will make sometime in the future. For now, let us keep it simple and sweet. As an example, I analyzed the most recent Consolidated Statement of Operations of iRobot (IRBT). You can access this statement at http://finance.yahoo.com/q/bs?s=IRBT. In Figure 2, you see the results of my final analysis. In the spreadsheet shown, I have added other balance sheet and profit & loss account figures that offer a slightly greater analysis.
FIGURE 2: RESULTS OF FINAL ANALYSIS. The buy rating is a 5+, which means that the share is definitely worth watching, perhaps even buying a small quantity. Note that EBITA -- that is, earnings before deduction of interest -- has been added. Fundamental analysts use it to evaluate companies. Tax and amortization expenses as well as a times earnings percentage, company performance rating, and a payout ratio have also been added. The latter are used mainly to compare one company in the same category to another. The buy rating is a 5+, which means that the share is definitely worth watching, perhaps even buying in a small quantity. I have added EBITA, which is an acronym that refers to a company's earnings before deduction of interest, a figure that fundamental analysts are using today to evaluate companies. I have also added tax and amortization expenses as well as a times earnings percentage, company performance rating, and a payout ratio. The latter are used mainly to compare companies in the same category. In Figure 3, you see the analysis spreadsheet with the formulas I used to analyze IRBT. Do play with the spreadsheet until you become familiar with it. You will find it very useful. For example, IRBT came out with a good profit figure in their latest quarterly report. However, the company projected slower earnings for the future. Traders sold the share, and the price dropped from a high of $39.83 to a low of $31.56. Yet the analysis of their balance sheet rates them as a 5+, which is a strong watch.
FIGURE 3: ANALYSIS SPREADSHEET. Here you see the formulas used to analyze iRobot. You may have to change some of the settings, depending on what type of company you are analyzing. |
| With banks, mining companies, and any company that does not have inventory, I will use the same figures as above but will rate them out of 7 rather than 8 with a "Watch me for a future buy" at 4. To compare companies that do not pay dividends, like Microsoft, I give them a dividend entry of one cent. A company that pays a dividend is always preferable to one that does not, but there are times when you would like to compare one against the other. SUGGESTED READING
Click here to download the Excel file (as a .zip) referenced in this article: ANALY.
|
Koos van der Merwe has been a technical analyst since 1969, having worked as a futures and option trader at a stock brokerage firm in Johannesburg, South Africa. He may be contacted at petroosp@gmail.com.
PRINT THIS ARTICLE

|

Request Information From Our Sponsors
- StockCharts.com, Inc.
- Candle Patterns
- Candlestick Charting Explained
- Intermarket Technical Analysis
- John Murphy on Chart Analysis
- John Murphy's Chart Pattern Recognition
- John Murphy's Market Message
- MurphyExplainsMarketAnalysis-Intermarket Analysis
- MurphyExplainsMarketAnalysis-Visual Analysis
- StockCharts.com
- Technical Analysis of the Financial Markets
- The Visual Investor
- VectorVest, Inc.
- Executive Premier Workshop
- One-Day Options Course
- OptionsPro
- Retirement Income Workshop
- Sure-Fire Trading Systems (VectorVest, Inc.)
- Trading as a Business Workshop
- VectorVest 7 EOD
- VectorVest 7 RealTime/IntraDay
- VectorVest AutoTester
- VectorVest Educational Services
- VectorVest OnLine
- VectorVest Options Analyzer
- VectorVest ProGraphics v6.0
- VectorVest ProTrader 7
- VectorVest RealTime Derby Tool
- VectorVest Simulator
- VectorVest Variator
- VectorVest Watchdog


