HOT TOPICS LIST
- Strategies
- Stocks
- Buy
- Investing
- Brokers
- Psychology
- Interviews
- Accumulate
- Sell
- Hold
- Spotlight
- Websites
- Candlestick Corner
- Gold & Metals
- Options Trading
LIST OF TOPICS
INVESTING
Systematic & Unsystematic Risk And CAPM
06/28/12 01:24:29 PM PSTby Daniel Subach
This article is a continuation of Subach's previous article concerning diversification and risk reduction. This time, he will explore systematic and unsystematic risk with respect to total risk of investment. The capital asset pricing model (CAPM) presents how the market prices securities and helps determine expected returns. You must be compensated for the risk of your investment, and the CAPM provides a measure of the risk premium and a tool for estimating your expected return curve.
| In my previous article, I indicated that combining securities into portfolios reduces risk. When securities are combined, a portion of a stock's variability in turn is canceled by complementary variations in the returns of other securities. The total risk is the sum of unsystematic risk and systematic risk. The capital asset pricing model's (CAPM) assumptions result in investors holding diversified portfolios to minimize risk. If the CAPM correctly describes market behavior, the measure of a security's risk is its market-related or systematic risk. The CAPM provides insight into the market's pricing of securities and the determination of expected returns. Therefore, it also has a clear application in investment management. The model relates to a firm's cost of equity capital and the cost of equity for the market as a whole. The tool will arm you with a simple equation to assist you in optimizing your investment decision and the creation of your portfolio. SYSTEMATIC & UNSYSTEMATIC RISK It is preferable to divide a security's total risk into a portion that is peculiar to a specific firm and can be diversified away (called unsystematic risk) and that portion that is market related and nondiversifiable (called systematic risk): Total risk =
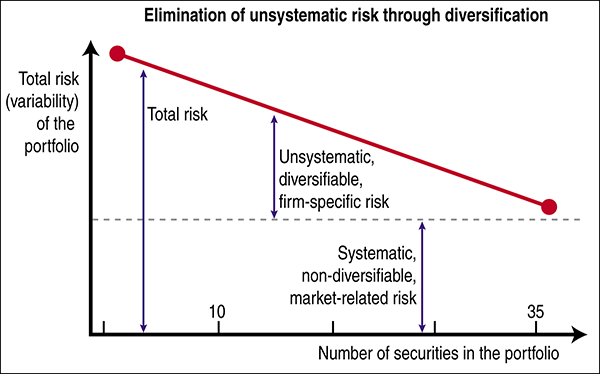
As the number of securities is added to a portfolio, the total risk is reduced. Our research indicates that unsystematic risk is minimized in portfolios of 35 (+/-5) securities drawn from industries that are not closely related. In general, holding 20 to 25 securities is a good rule of thumb, as most people cannot hold 30 to 40. |
| Figure 1 indicates the reduction of total risk, as securities are added to a portfolio. The remaining systematic risk is market related. The diversified portfolio will tend to move in tandem with the market. Popular market indexes -- for example, Dow Jones Industrial Average (DJIA), Standard & Poor's 500, NYSE, and AMEX -- are themselves diversified portfolios and will tend to move in parallel.
FIGURE 1: ELIMINATION OF UNSYSTEMATIC RISK THROUGH DIVERSIFICATION. As securities are added to a portfolio, the total risk is reduced. The remaining systematic risk is market related. Accordingly, there is a close relationship between movement in the returns of any diversified portfolio and in the returns of market indexes. Some examples of systematic risk are boycotts, massive tax action, restrictive money policies, and skyrocketing interest rates. Some examples of unsystematic risk are the death of Steve Jobs, a wildcat strike of the United Auto Workers, Nokia suddenly enters the Microsoft market, and oil is discovered in your backyard. RISK, RETURN, AND MARKET EQUILIBRIUM The expected return = Risk-free return + Risk premium
In other words, the expected return will vary with the risk premium based upon the flat risk-free return. The curve can be linear or exponential, depending upon the risk premium investment. CAPITAL ASSET PRICING MODEL |
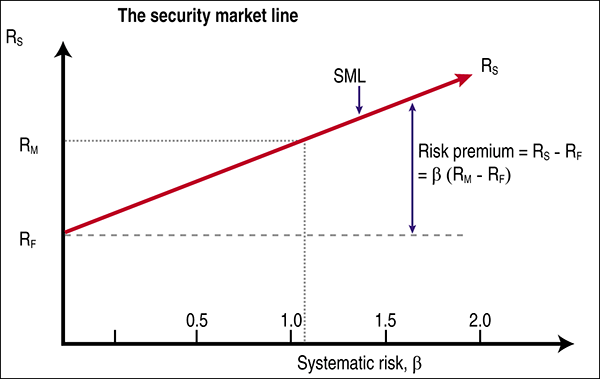
| The assumption of the model results in a world where investors hold diversified portfolios to minimize risk. The only risk that an investor is sensitive to is systematic or market-related risk. The idea is that variations in returns from one security will likely be canceled by complementary variations in the returns of other securities in your portfolio. You are rewarded with a higher expected return for holding market-related risks. The result of the CAPM is that a security's return is related to the portion of risk that cannot be eliminated by portfolio combination. CAPM provides a convenient measure of systematic risk. This measure is known as beta (β) and gauges the tendency of a security's return to move in parallel with the overall market's return. A good way to think of β is as a measure of a security's volatility relative to the market's volatility. If the stock has a beta of 1.0, it tends to rise and fall the same percentage as the market (for example, Standard & Poor's 500). Accordingly, β = 1.0 indicates an average level of systematic risk. If beta is greater than 1.0, the stock will change more than the market changes and will have a high level of systematic risk, since there is greater sensitivity to market changes. A beta of less than 1.0 has a low level of systematic risk and is less sensitive to market swings. The results determine the risk-expected return tradeoff under the CAPM. We know that RS = RF + Risk premium. Then the CAPM describes market behavior by RS = RF + β (RM − RF)
This equation states that the expected return on a security is equal to the risk-free rate (RF) plus a risk premium. The risk premium is β times the return on the market (RM) minus the risk-free rate. We can also restate the equation RS − RF = β (RM − RF) which is equal to the risk premium for security S. The risk premium on a stock or portfolio varies directly with the level of systematic risk, beta. The risk or expected return tradeoff with CAPM is called the security market line (SML). The SML is pictured in Figure 2.
FIGURE 2: SECURITY MARKET LINE. The risk premium on a stock or portfolio varies directly with the level of systematic risk, beta. The security market line (SML) shows you the risk or expected return tradeoff with CAPM. |
| Consider a company engaged in launching spacecraft. The return to you is variable. If the spacecraft is successfully launched, the return is very high. If the company fails to perform, however, you lose your investment. The total risk level of this stock is very high. This risk is unsystematic, because it is unique to this company. Since this stock's return is not closely related to the return on the market as a whole, it will contribute little to the variability of your diversified portfolio. Its unsystematic risk can be diversified away by holding a large portfolio. However, the costs of launching the vehicle and the price of fuel are related to the level of economic activity, and this stock does contain some market-related risk. Most of the total risk is unsystematic related to the successful launching of the craft, even though the stock appears risky. In terms of total risk, it has a low level of systematic risk and the β might be 0.7. The market will price this stock to yield a relatively low expected return. If you hold a large portfolio, it is a low-risk security. Consider a company that manufactures operating systems software. It is large and stable and its total variability in return is less than that of the spacecraft company. However, its sales, earnings, and stock returns are closely related to the changes in overall economic activity. The return on its stock is sensitive to changes in the return on the market as a whole. Its risk cannot be eliminated by diversification. When this stock is combined with other securities in your portfolio, changes in its return reinforce swings in the returns of the other securities. It has a high level of systematic risk and a β of over 1, perhaps 1.6. Because of its high level of non-diversifiable risk, the market considers this stock risky. It is priced to yield a high-expected return. In general, most companies with high total risk have high beta, and companies with low total risk have low beta. EXPECTED RETURN Let us summarize the determination of expected return with the CAPM:
|
| SUGGESTED READING
SIDEBAR: CONSIDERATIONS WITH CAPM Potential shareholders' expectations are biased, causing market prices to provide inefficient information. This possibility is studied in the field of behavioral finance, which uses psychological assumptions to provide alternatives to the CAPM such as the overconfidence-based asset pricing model. It has been found that although an investor is more than 90% confident in security selection and performance based upon belief, the actual performance is substantially less. The CAPM does not adequately explain the variation in certain stock returns. Empirical studies show that some low beta stocks may offer higher returns than the model would predict. In addition, the CAPM might not be empirically testable. This argument was presented by Richard Roll's 1977 paper. The model focuses over a short-term horizon. If you have a longer-term outlook you might select long-term inflation-linked bonds instead of short-term rates, as this would be more risk-free. However, this action is individual investor imposed. You must rebalance your portfolios over time, as the CAPM assumes that active and potential shareholders will consider all assets and optimize one portfolio. Individual shareholders tend to have multiple portfolios and a goal for each. It is usual to have multiple portfolios -- for example, an IRA, 401k, capital return, fixed income, and so on. You would just have a CAPM for each of your portfolios and plan review and rebalancing in the course of the normal investment process. The model was introduced by a 1964 article by William F. Sharpe and others. The CAPM assumes that the risk-return profile of a portfolio can be optimized. An optimal portfolio displays the lowest possible level of risk for its level of return. Since each additional asset introduced into a portfolio further diversifies the portfolio, the optimal portfolio must make up every asset, with each asset value-weighted to achieve an optimized risk-return portfolio. |
Daniel Subach has a master's degree in physics, a doctorate in chemistry, and an MBA in marketing and strategic planning. He is CEO of Proteome Diagnostics and president of InPro Technologies. He provides stock analyses, strategic planning marketing research, and business development services for asset investment, private equity, and securities evaluation for individuals and corporations. His primary research interests are in the areas of risk minimization and oscillating models to describe stock performance and as predictors of future stock performance. Contact him at db17976@att.net.
| E-mail address: | db17976@att.net |
PRINT THIS ARTICLE

Request Information From Our Sponsors
- StockCharts.com, Inc.
- Candle Patterns
- Candlestick Charting Explained
- Intermarket Technical Analysis
- John Murphy on Chart Analysis
- John Murphy's Chart Pattern Recognition
- John Murphy's Market Message
- MurphyExplainsMarketAnalysis-Intermarket Analysis
- MurphyExplainsMarketAnalysis-Visual Analysis
- StockCharts.com
- Technical Analysis of the Financial Markets
- The Visual Investor
- VectorVest, Inc.
- Executive Premier Workshop
- One-Day Options Course
- OptionsPro
- Retirement Income Workshop
- Sure-Fire Trading Systems (VectorVest, Inc.)
- Trading as a Business Workshop
- VectorVest 7 EOD
- VectorVest 7 RealTime/IntraDay
- VectorVest AutoTester
- VectorVest Educational Services
- VectorVest OnLine
- VectorVest Options Analyzer
- VectorVest ProGraphics v6.0
- VectorVest ProTrader 7
- VectorVest RealTime Derby Tool
- VectorVest Simulator
- VectorVest Variator
- VectorVest Watchdog


