HOT TOPICS LIST
- Strategies
- Stocks
- Buy
- Investing
- Brokers
- Psychology
- Interviews
- Accumulate
- Sell
- Hold
- Spotlight
- Websites
- Candlestick Corner
- Gold & Metals
- Options Trading
LIST OF TOPICS
TRADER'S NOTEBOOK
Individual Traders Manage Risk Better
06/29/12 10:00:31 AM PSTby Mike Carr, CMT and Amber Hestla-Barnhart
How can individual traders manage risk?
| Every successful trader learns to manage risk so they can avoid large losses like those that have crippled many Wall Street firms. In this article, we'll show how traders manage risk, identify the lessons we can learn from JPMorgan, and detail a way that technicians can duplicate the value at risk (VAR) metric that many large firms use to help add insight to their potential losses. In what has become a fairly regular event, a Wall Street firm has announced a multibillion-dollar trading loss. JPMorgan told analysts and investors in early May that a hedge trade they had made would lead to a loss of at least $2 billion. CEO Jamie Dimon said that the firm "screwed up" and a number of mistakes allowed the loss to occur. He said that the trades were "riskier, more volatile, and less effective as an economic hedge than we thought." Individual traders face the same challenges with trades that don't always behave as expected and they generally use a number of techniques to minimize the chance of a large loss. Individual traders have different motivations than institutional traders. Often, the individual is trying to make sure they have enough money for retirement or they may even depend on trading profits as their primary source of income. In contrast, institutional traders have a base salary to cover their monthly expenses, and benefits often include a well-funded retirement plan. For them, trading increases their bonuses, which means they would be more aggressive than individual traders. Because of this, institutional traders may not use the simple risk management tools that an individual would. FIVE SIMPLE RULES TO MANAGE RISK In the JPMorgan trade, the trader seemed to be concentrating his bets in a single derivatives market. In a Bloomberg News story about the loss, the wire service noted that it "first reported April 5 that [the trader in London at the center of the problem] had built positions that were so large he was driving price moves in the $10 trillion market for credit-swap indexes." |
Later reports indicated that a large portion of the trade involved a single credit default swap contract. That the trader was moving the price against his position indicates that his position size was probably too large. Of course, the size of the loss also indicates the position size was too large, so we can immediately draw three important lessons from the JPMorgan trade:
Other risk management strategies include using stop-losses. Many traders enter a stop when they open a trade. Other traders believe that stop-losses can hurt profitability, a concern that has proved true in many systems that are backtested. However, even traders who consider stops to be harmful to profits often enter a stop far away from the market price, perhaps 20% to 25% away, to avoid losses that can end their trading careers. That provides the fourth lesson from the JPMorgan trade:
With or without stops, individual traders usually limit their potential losses with position sizing. Large traders may only put 2% of their trading capital at risk on any trade. Smaller traders may need to risk a third to a half of their account size in order to accommodate the average trading range in their market. By using this risk management strategy, stop-loss orders can be eliminated, and that could give more trades time to work. If only 5% of capital is risked in a trade, it would take about 130 consecutive losses to lose 99% of the beginning capital. That is another lesson:
These simple rules seem to have been overlooked by JPMorgan and Lehman Brothers before that, and Bear Stearns before that. There are other examples of hedge funds that ignored these simple ideas and blew up. |
| COMPLEX FORMULAS DEFINE RISK Institutional traders prefer ideas like value at risk (VAR) to define their risk rather than calculating how much they can lose by summing the difference between the market price and their stop-loss for each open position. Value at risk is a more complex calculation and firms use different variations of the calculation, but one way to find VAR is given with this formula: VAR = (µ + z * σ) * P The result is the maximum dollar amount that they can expect to lose 95% of the time. Individual traders understand that the gains on losses on the most extreme 5% of trading days can account for the bulk of a trader's results in a year, yet VAR ignores this idea and defines risk in terms of what can happen on a normal day. The problems with VAR have long been known. During the subprime crisis that sparked the bear market in 2007, Goldman Sach's CFO was quoted as saying, "We were seeing things that were 25-standard deviation moves, several days in a row." It is difficult to comprehend how infrequent a 25-standard deviation event would be expected to occur. An eight-standard deviation event would be expected about once in 6.5 trillion years. But market selloffs happen much more frequently than that and there almost always seem to be at least a few very bad days within a short time span every year. In the reality of trading, losses will exceed the VAR calculation fairly frequently if you are using two standard deviations in a VAR model. A two-standard deviation event should be expected about once every two months (once every 44 trading days), so traders will frequently see days when their account value changes by an amount that is more than VAR calculated. There are assumptions built into the VAR and different assumptions can give different results. In the $2 billion loss, JPMorgan has said that the traders making the bet believed that the VAR was about $67 million, but a different model that the firm used showed that the VAR was actually $129 million. Dimon concluded that the method used for calculating VAR was "inadequate." |
| A SIMPLER CALCULATION FOR INDIVIDUAL TRADERS Individual traders may not want to model VAR, but they can determine how much money is at risk under normal conditions by applying Bollinger Bands to their account value. To find a rough equivalent of VAR:
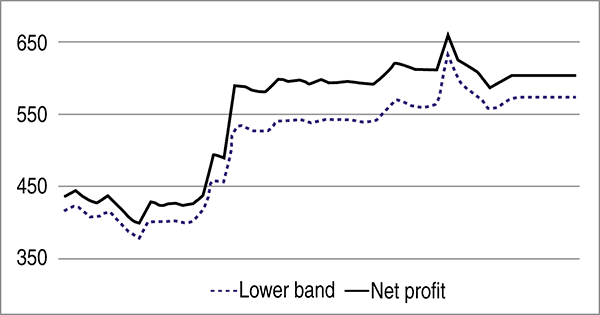
An example of this is shown in Figure 1, where, in effect, a lower Bollinger Band has been added to the system's trading account balance. A simple four-week channel breakout system trading a basket of commodities was used to generate account values, which can also be called an equity curve. The dollar amount at risk varies with the account balance and the recent trading performance. The lower band in this example is calculated using a 20-week lookback period.
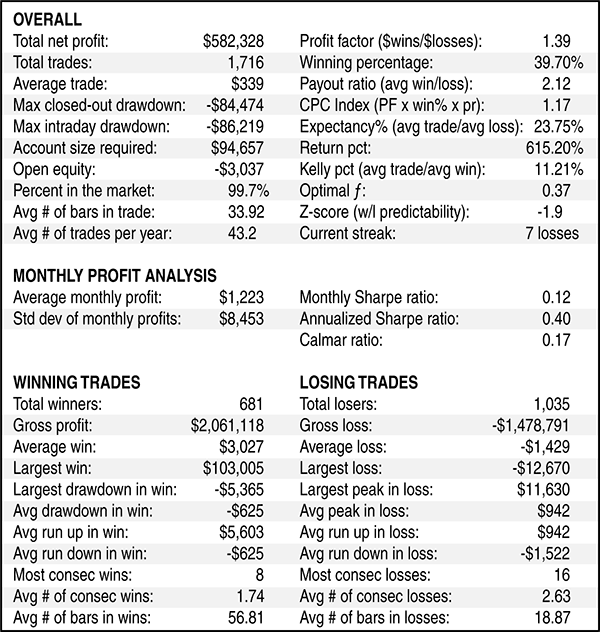
FIGURE 1: EQUIVALENT OF VALUE AT RISK (VAR). Here, a lower Bollinger Band has been added to the system's trading account balance. The lower band in this example is calculated using a 20-week lookback period. A typical system trading report for this channel system, generated with Trade Navigator software and data, is shown in Figure 2.
FIGURE 2: SIMPLE STRATEGY. This simple strategy (buy new 4-week highs and sell new 4-week lows) is profitable over time. This back test covered a period of about 40 years. The worst loss in any month on a dollar basis exceeded the lower Bollinger Band only twice in the 460-month testing period. That means every month, it is relatively simple to obtain a number comparable to VAR at the 95% confidence level by applying Bollinger Bands to actual account performance. Gains exceeded the upper band significantly more often, almost 6.5% of the time. One reason to complete these calculations is to understand the "normal" potential losses of your system. By finding two standard deviations of your equity curve, you can turn losses from a theoretical figure to a defined dollar amount. If that amount makes you uncomfortable, change the system to reduce the risk. If the level of risk seems too small, you can become more aggressive. This concept also introduces the idea of applying technical analysis to your equity curve. Consider adding a moving average to the equity curve. A 30-period moving average works well, although any other time period can be used. No system will always be in synch with the market. When the equity curve is below the moving average, that is a signal that the system is out of synch, and putting that system aside until the equity curve is back above the moving average can help avoid large losses. EXPERIENCE IS THE BEST TEACHER Individual traders can learn important lessons from JPMorgan's multibillion-dollar loss. There are a number of simple lessons regarding risk management and there is also the idea of regularly examining your trading performance with an analysis of your equity curve. The lessons learned from this loss could be valuable to individual traders, especially those who could not survive a $2 billion loss. |
Mike Carr is a member of the Market Technicians Association and editor of the MTA's newsletter, Technically Speaking, and author of two investment books. He is a full-time trader and writer. Amber Hestla-Barnhart is an independent market researcher. She is a frequent contributor to financial publications in the US and Great Britain, and her work has previously been featured in Technical Analysis of STOCKS & COMMODITIES.
PRINT THIS ARTICLE

Request Information From Our Sponsors
- VectorVest, Inc.
- Executive Premier Workshop
- One-Day Options Course
- OptionsPro
- Retirement Income Workshop
- Sure-Fire Trading Systems (VectorVest, Inc.)
- Trading as a Business Workshop
- VectorVest 7 EOD
- VectorVest 7 RealTime/IntraDay
- VectorVest AutoTester
- VectorVest Educational Services
- VectorVest OnLine
- VectorVest Options Analyzer
- VectorVest ProGraphics v6.0
- VectorVest ProTrader 7
- VectorVest RealTime Derby Tool
- VectorVest Simulator
- VectorVest Variator
- VectorVest Watchdog
- StockCharts.com, Inc.
- Candle Patterns
- Candlestick Charting Explained
- Intermarket Technical Analysis
- John Murphy on Chart Analysis
- John Murphy's Chart Pattern Recognition
- John Murphy's Market Message
- MurphyExplainsMarketAnalysis-Intermarket Analysis
- MurphyExplainsMarketAnalysis-Visual Analysis
- StockCharts.com
- Technical Analysis of the Financial Markets
- The Visual Investor


