HOT TOPICS LIST
- Strategies
- Stocks
- Buy
- Investing
- Brokers
- Psychology
- Interviews
- Accumulate
- Sell
- Hold
- Spotlight
- Websites
- Candlestick Corner
- Gold & Metals
- Options Trading
LIST OF TOPICS
TRADER'S NOTEBOOK
Intermarket Checkup
08/01/12 09:25:59 AM PSTby Matt Blackman
Where the heck are we, anyway? Knowing where we are now and what economic forces are in play in the broader scheme of things can be useful in anticipating where we're headed.
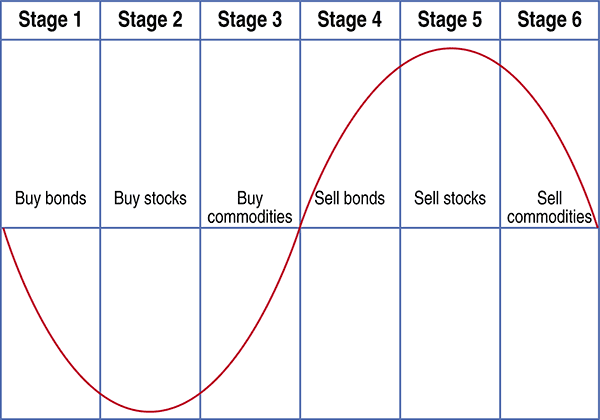
| In his latest book, Investing In The Second Lost Decade, Martin Pring et al. provide a credible explanation about the business cycle and how it can be used to enhance investment and trading decisions. Pring breaks the idealized cycle down into six stages and provides an overview of how the three major asset classes (bonds, stocks, and commodities) should be performing at each stage of the cycle. According to Pring, bonds should lead stocks and stocks should lead commodities on the way up and down in a textbook cycle. Figure 1 is the stylized diagram of the Pring-Turner business cycle:
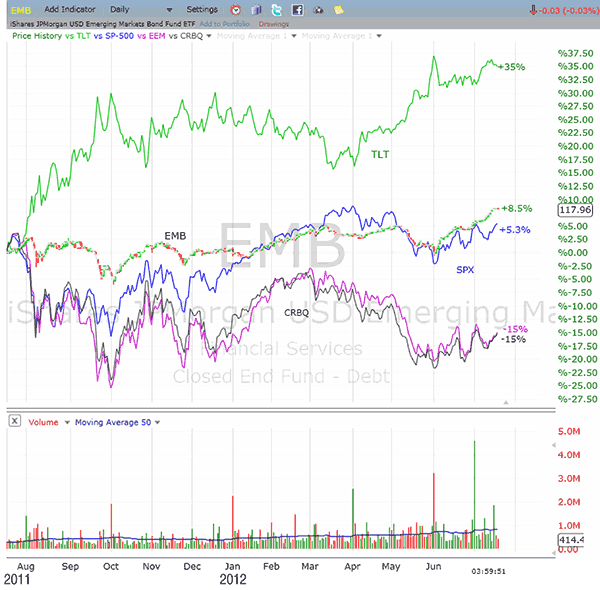
FIGURE 1: Daily chart comparing US bonds (TLT), emerging market bonds (EMB) with the S&P 500 (SPX) and commodities (CRBQ) over the last year. TO EVERYTHING A SEASON Stage 2: At this point, the economy has bottomed. Stocks have begun to move up behind bonds. Stage 3: As the economy improves, inflation begins to creep in, which is good for commodities that have bottomed and stocks at least in the early inflationary stages. This is a good time to buy commodities. Bonds, stocks, and commodities move up together during stage 3 as the economy continues to expand. Stage 4: At this point, economic expansion is slowing and interest rate hikes should have been instituted in an attempt to slow inflation (although that didn't happen in the last recovery). As interest rates rise, bond prices soften since interest rates and bond prices move inversely to one another. It's time to sell bonds. Stocks and commodities are still moving up, but stocks will begin to slow as interest rates begin to have an impact on corporate earnings and borrowing rates. Stage 5: Economic expansion has peaked as interest rates take their toll on corporate profits and the economy. It's time to sell stocks. Commodities are still rising, but they will begin to level off soon. As we learned in 2007 and 2008, the bigger the bubble that has formed in various assets during the expansion phase, the more severe the resulting correction. Stage 6: Efforts to cool inflation have worked, but now the economy is contracting and this trend gathers momentum. It's time to sell commodities. Stock prices are still falling, even though corporate profits have begun to improve -- a reality that can last for an extended period during a secular or long-term bear market. (Please refer to my Traders.com Advantage article "The Fundamental Disconnect" for a more detailed discussion.) |
| According to Pring et al., there was a total of 33 full (peak-to-peak) business cycles between 1857 and 2009, with the average cycle lasting 4.66 years (56 months). The longest from July 1990 to March 2001 lasted 10 years and eight months and the shortest (August 1918-January 1920) lasted one year and five months. LETTING THE CHARTS DO THE TALKING
FIGURE 2: Stylized diagram of the business cycle. Figure 2 shows a one-year chart of the iShares JP Morgan Emerging Market Bond ETF (EMB) together with the iShares Barclay's 20+ Year Treasury Bond ETF (TLT), the Standard & Poor's 500 (SPX), the iShares MSCI Emerging Markets exchange traded fund (ETF) (EEM), and the Thomson Reuters/Jefferies Global Commodity ETF (CRBQ). As we see, in the last 12 months, US and emerging market bonds did well -- US bonds were by far the best performers, up 35% compared to emerging market bonds (up 8.5%) as investors flocked to Treasuries as a safe haven in spite of historically low yields. In comparison, US stocks (SPX) were up just over 5% over the same period. However, commodities and emerging market stocks (which are more commodity dependent) are both down around 15%. Since emerging markets now provide many of the products needed to drive economic expansion in the rest of the world, they should react ahead of stocks in developed nations. Generally, bonds would be expected to be strong during stage 1 of an economic expansion, but it is unlikely that we are in stage 1, given that US stocks have been going up since March 2009 and the rally is more than three years old. However, based on the discussion of the six stages and given the asset performances outlined with stocks and bonds higher, we should be in stage 2. |
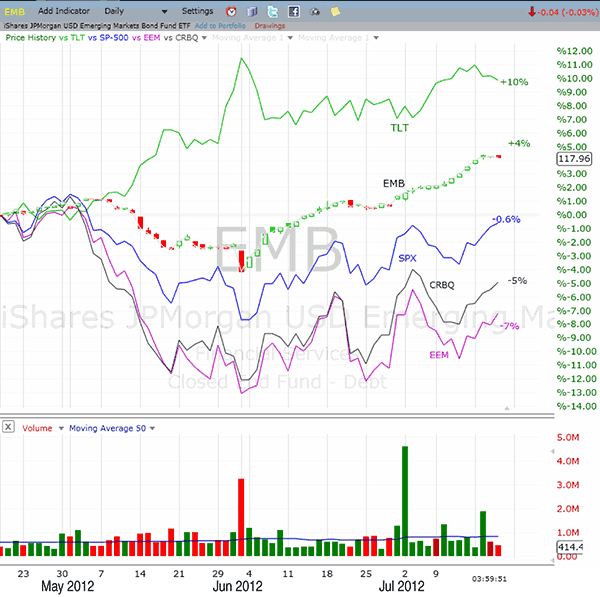
| But as we see in Figure 3, stocks were flat in the latest three months shown, indicating that only bonds made money. This more recent synopsis suggests we are in stage 1.
FIGURE 3: Same chart as in Figure 2 but for the last three months. SHOVELING WATER But despite these efforts, the US economy is showing signs of slowing and deflation has outpaced inflation as an economic concern, which indicates a stop-start-stop process of stunted recovery followed by mild contraction. As we were enjoying the last weeks of summer and preparing for the last Presidential election, it looked as though the 2009 recovery was cooling in North America, but it was cooling even more in emerging markets, which explained the commodity weakness at the time. PLAYING MUSICAL CHAIRS From May to July 2012, there were a number of times when investors got excited about the prospect of more quantitative easing due to disappointing jobs and economic data. Stocks will initially get a lift if another round of quantitative easing (QE) is announced. But the problem is that each round of QE since the Troubled Asset Relief Program (TARP) became law in 2008 has triggered a diminished impact on stock prices. Any benefit from here should be muted, despite political efforts in Washington to put voters in a good mood with costly election promises. |
| Another risk factor to contemplate is the potential for the euro to do a dissolving act once European politicians, or more likely their constituents, come to their senses and realize just how untenable the single currency really is among such politically and economically disparate nations. There is also one more very powerful cycle to consider -- the four-year election cycle -- and although the last eight years have been anything but typical, markets have been historically weakest in the post-election year. Any efforts by the incumbent party to stimulate the economy in the remainder of 2012, like those of the previous stimulus and bailout programs, will have to be paid back after the election is over. Deciding what to buy and when remains the hardest ongoing decision that traders and investors must make. As always, stop-losses are essential when buying or selling any stocks, bonds, or commodities to reduce stress and handle unexpected contingencies or just in case the current economic cycle gets unexpectedly turned on its head. SUGGESTED READING
|
Matt Blackman is a full-time technical and financial writer and trader. He produces corporate and financial newsletters, and assists clients in getting published in the mainstream media. He tweets about stocks he is watching at www.twitter.com/RatioTrade Matt has earned the Chartered Market Technician (CMT) designation.
| E-mail address: | indextradermb@gmail.com |
PRINT THIS ARTICLE

|

Request Information From Our Sponsors
- StockCharts.com, Inc.
- Candle Patterns
- Candlestick Charting Explained
- Intermarket Technical Analysis
- John Murphy on Chart Analysis
- John Murphy's Chart Pattern Recognition
- John Murphy's Market Message
- MurphyExplainsMarketAnalysis-Intermarket Analysis
- MurphyExplainsMarketAnalysis-Visual Analysis
- StockCharts.com
- Technical Analysis of the Financial Markets
- The Visual Investor
- VectorVest, Inc.
- Executive Premier Workshop
- One-Day Options Course
- OptionsPro
- Retirement Income Workshop
- Sure-Fire Trading Systems (VectorVest, Inc.)
- Trading as a Business Workshop
- VectorVest 7 EOD
- VectorVest 7 RealTime/IntraDay
- VectorVest AutoTester
- VectorVest Educational Services
- VectorVest OnLine
- VectorVest Options Analyzer
- VectorVest ProGraphics v6.0
- VectorVest ProTrader 7
- VectorVest RealTime Derby Tool
- VectorVest Simulator
- VectorVest Variator
- VectorVest Watchdog


