HOT TOPICS LIST
- Strategies
- Stocks
- Buy
- Investing
- Brokers
- Psychology
- Interviews
- Accumulate
- Sell
- Hold
- Spotlight
- Websites
- Candlestick Corner
- Gold & Metals
- Options Trading
LIST OF TOPICS
MUTUAL FUNDS
The Hot New Mutual Fund Tool
01/26/01 12:07:02 PM PSTby Jayanthi Gopalakrishnan
How do exchange traded funds, the newcomer to the investment scene, stack up against index funds? Compare the costs and find out which fund fits your investment strategy.
| In spite of their existing array of investment products, mutual fund companies have begun to offer a new tool, the exchange traded fund (ETF), to their customers. "It's no surprise, considering that their performance, lower costs, and flexibility to get in and out of the product quickly makes them an attractive investment tool," comments Peter Stolcers, director of marketing at Terra Nova Trading, LLC. The lower expenses associated with ETFs have attracted attention, but before jumping into this hot new investment tool, it may be a good idea to determine whether you, as an investor, would benefit from their lower costs. EXPENSES When it comes to managing money, you are always going to encounter costs. These can include management fees, advertising and marketing costs, and administrative costs. These costs should not be ignored; even a slight difference can affect the performance of your investment. Expenses are usually expressed in terms of basis points on an annual basis. For example, if the expense ratio of a fund is 18 basis points, you will end up paying 18% annually. These expense ratios do not include brokerage fees, which usually do not apply to mutual funds. However, when you buy or sell ETFs, you must pay commissions to your broker in addition to annual expenses. There are several classes of exchange shares, such as Spdrs (Standard & Poor's depositary receipts), WEBS (World Equity Benchmark Shares), DIA (Dow Jones Industrial Average), HOLDRS (holding company depositary receipts), and sector SPDRS. These classes are set up differently, but all involve expenses. The expenses are similar to those of index mutual funds, such as advertising and marketing fees, plus fees to the Securities and Exchange Commission (SEC). These expenses are a percentage of the funds' assets. As the funds grow, typically, the expense ratios decline.
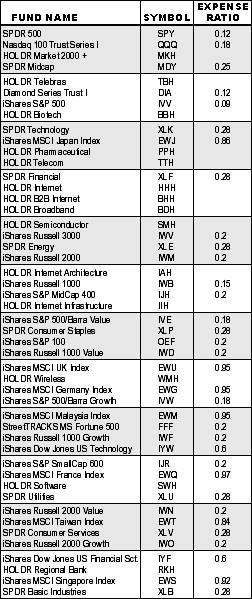
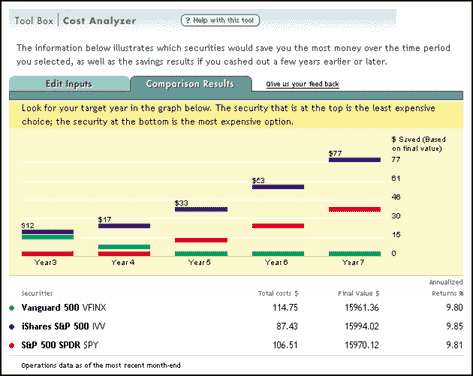
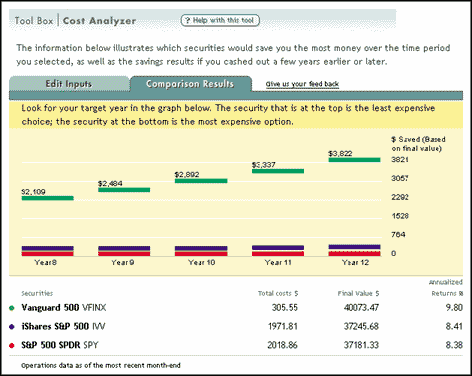
Generally, index funds are cheaper to manage than actively managed funds. The Vanguard 500 has the lowest expense ratio of all index funds, which at present is 18 basis points. Most index funds charge about 30 basis points. Since most ETFs are index funds, their costs will be less than those of actively managed funds. The biggest cost advantage of ETFs over the traditional index fund is in back-end expenses. In a traditional open-end fund, a transfer agent like a bank takes on responsibilities such as maintaining accounts, keeping track of sales charges, and linking salespeople to customers. In an ETF, many of these transfer agent functions are eliminated, making the funds cheaper to manage. In addition, your broker handles all your trading activity, which involves keeping track of your buys and sells. Yes, this is a transfer agent function. However, in an ETF, it is simplified, making it more efficient and less expensive, and thus reducing the expense ratio. BENEFITS Can the reduced expenses associated with ETFs improve your investment returns? I compared the expenses of index funds and ETFs to determine whether there really is a cost benefit in owning ETFs. The expense ratios of ETFs ranged from 9 basis points, or 0.09% (iShares S&P 500), to 99 basis points, or 0.99% (iShares MSCI South Korea Index). Given this wide range, it is best to compare an ETF to funds of a similar class or category. Fortunately, the Morningstar website (www.morningstar.com) has a section on ETFs that provides a cost analysis tool. This makes it easy to analyze costs between the traditional index fund and the ETF. The display in Figure 2 shows how this cost analysis tool works. Assuming an initial investment of $10,000, expected return of 10%, $15 commissions, and a five-year time horizon using the large blend as an example, the results display that after three years, the iShares 500 (IVV) was the least-expensive choice. After five years, the expenses associated with holding the Standard & Poor's 500 SPDR (SPY) were lower than those of the Vanguard 500 index fund (VFINX).
SUMMARY Before plunging into ETFs, do a cost analysis and determine whether ETFs are likely to help you reach your investment goals. Clearly, if you follow the buy-and-hold strategy and make a lump-sum initial payment, you may find ETFs to be cost effective. However, if you plan to use dollar cost averaging, you are better off using conventional mutual funds. |
Staff Writer
| Title: | Staff Writer |
| Company: | Technical Analysis, Inc. |
| Address: | 4757 California Ave SW |
| Seattle, WA 98116 | |
| Phone # for sales: | 206 938 0570 |
| Fax: | 206 938 1307 |
| Website: | working-money.com |
| E-mail address: | Jayanthi@traders.com |
Traders' Resource Links | |
| Charting the Stock Market: The Wyckoff Method -- Books | |
| Working-Money.com -- Online Trading Services | |
| Traders.com Advantage -- Online Trading Services | |
| Technical Analysis of Stocks & Commodities -- Publications and Newsletters | |
| Working Money, at Working-Money.com -- Publications and Newsletters | |
| Traders.com Advantage -- Publications and Newsletters | |
| Professional Traders Starter Kit -- Software | |
PRINT THIS ARTICLE

Request Information From Our Sponsors
- VectorVest, Inc.
- Executive Premier Workshop
- One-Day Options Course
- OptionsPro
- Retirement Income Workshop
- Sure-Fire Trading Systems (VectorVest, Inc.)
- Trading as a Business Workshop
- VectorVest 7 EOD
- VectorVest 7 RealTime/IntraDay
- VectorVest AutoTester
- VectorVest Educational Services
- VectorVest OnLine
- VectorVest Options Analyzer
- VectorVest ProGraphics v6.0
- VectorVest ProTrader 7
- VectorVest RealTime Derby Tool
- VectorVest Simulator
- VectorVest Variator
- VectorVest Watchdog
- StockCharts.com, Inc.
- Candle Patterns
- Candlestick Charting Explained
- Intermarket Technical Analysis
- John Murphy on Chart Analysis
- John Murphy's Chart Pattern Recognition
- John Murphy's Market Message
- MurphyExplainsMarketAnalysis-Intermarket Analysis
- MurphyExplainsMarketAnalysis-Visual Analysis
- StockCharts.com
- Technical Analysis of the Financial Markets
- The Visual Investor


