HOT TOPICS LIST
- Strategies
- Stocks
- Buy
- Investing
- Brokers
- Psychology
- Interviews
- Accumulate
- Sell
- Hold
- Spotlight
- Websites
- Candlestick Corner
- Gold & Metals
- Options Trading
LIST OF TOPICS
INDICATORS
Aroon Points The Way
08/30/12 11:28:17 AM PSTby Rudy Teseo
Don't let the intimidating look of this indicator keep you from exploring its capabilities.
| At first glance, the Aroon indicator appears that somehow, two plots got mixed together in the same pane. It's hard enough learning how to analyze a single-line indicator and adapting it to our own needs, let alone keeping track of two plots in one space! The first time I saw the Aroon indicator, it reminded me of my early approach to the piano: wondering how I would ever get my two hands to do different things at the same time. AROON The indicator consists of two line studies (plots) labeled Aroon Up (AU) and Aroon Down (AD). These names have no significance concerning direction; they are merely the names given to the plots. AU may be down at zero, while AD may be up at 100. In fact, this situation is one of the conditions we look for in our analysis. Interpretation of the two plots revolves around three conditions: the extremes at zero and 100, indicating strength or weakness of uptrends or downtrends; crossovers of the two plots, indicating a possible change in direction or a change from trending to trading; and parallel movement between AU and AD, indicating a period of consolidation. AU at 100 indicates strength. AU remaining between 70 and 100 indicates an uptrend. AD at zero indicates weakness; AD remaining between zero and 30 indicates a downtrend. If both plots remain at extreme levels, a strong trend is indicated. If AU remains between 70 and 100 while AD remains between zero and 30, then a strong uptrend is indicated. |
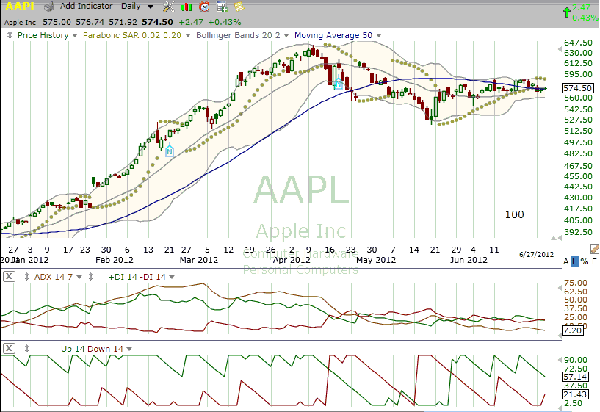
| This is shown on the daily chart of Apple, Inc. (AAPL), in Figure 1. From the period of January 3, 2012, through April 10, 2012, AU remained between 100 and 65, while AD remained between zero and 35. AAPL increased its share price from 409 to 644 (a new high); the next day, AU started down and price followed.
FIGURE 1: APPLYING AROON. From January 3, 2012, through April 10, 2012, AU remained between 100 and 65, while AD remained between zero and 35. AAPL increased from 409 to 644 (a new high). Other conditions to look for are the AU and AD crossovers as well as consolidations. Another condition to look for is the crossover. On April 13, 2012, AD started up and crossed AU, which continued toward zero. Note that on the day AD started up, the stop and reverse (SAR) switched from long to short. On the day of the plot crossover, the directional movement index (DMI) plus also crossed down through DMI minus. Are we getting confirmation? Another condition to look for is parallel movement between the two plots of AU and AD. The period from April 11, 2012, through May 10, 2012, is not exactly textbook consolidation. However, parallel movement is also interpreted as expecting further consolidation until a major change is indicated. The parallel movements that follow are accompanied by a trading range during that period. |
For the mathematically inclined, if you wish to experiment with different periods, the following equations can be used where n is the period. I tried periods of five and 21. I found that a short period is too sensitive, where even one down day in an uptrend leads to whipsaw-like patterns. A longer period produced a more textbook result; during the period from January 3, 2012, through April 10, 2012, AU ranged between 70 and 100, and AD ranged between zero and 30.
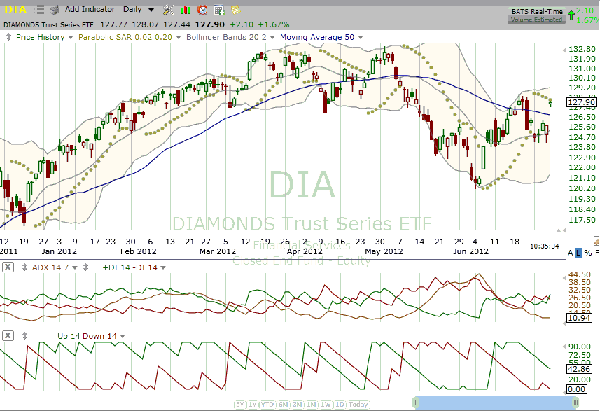
The daily chart of the Diamonds exchange traded fund (ETF) (DIA) in Figure 2 is another good example of how Aroon works. On December 20, 2011, we see the ETF coming out of consolidation. AD starts back down, and the next day, AU starts back up. This is followed by the AU and AD movement, with AU staying within a range of 65 to 100 and AD within zero to 35. Keep in mind that this is our configuration, indicating a strong uptrend that occurred between December 20, 2011, and March 16, 2012. Note that every down day in the uptrend is accompanied by a downward move in AU. You might think this is a sell signal (similar to the stochastic crossing down through 80).
FIGURE 2: AROON ON THE DIAMONDS. On December 20, 2011, we see DIA coming out of consolidation. AD starts back down, and the next day AU starts back up. This is followed by the familiar AU and AD movement, with AU staying within a range of 65 to 100 and AD staying within a range of zero to 35. But your assumption would be incorrect. Thus, you would need to establish some trading signals that are applicable to your trading goals. |
| Note that 70 seems to be a support level, and only when this is breached is there a change of direction. The crossover on March 6, 2012, signals the end of the minor correction after which the uptrend continued. This is followed by a period of parallel plots and consolidations. A switch of AU and AD plots and a crossover on May 7, 2012, starts a severe downtrend with both AU and AD at opposite extremes. THE UPS AND DOWNS Once you are satisfied that the Aroon can stand alone, delete your indicators and paper trade for a period using just the Aroon. The results, good or bad, should help you decide how well the Aroon works for you. |
Rudy Teseo is a private investor who trades stocks, options, and currencies. He has taught classes in technical analysis and option trading. He may be reached at rftess@optonline.net.
| E-mail address: | rftess@optonline.net |
PRINT THIS ARTICLE

Request Information From Our Sponsors
- StockCharts.com, Inc.
- Candle Patterns
- Candlestick Charting Explained
- Intermarket Technical Analysis
- John Murphy on Chart Analysis
- John Murphy's Chart Pattern Recognition
- John Murphy's Market Message
- MurphyExplainsMarketAnalysis-Intermarket Analysis
- MurphyExplainsMarketAnalysis-Visual Analysis
- StockCharts.com
- Technical Analysis of the Financial Markets
- The Visual Investor
- VectorVest, Inc.
- Executive Premier Workshop
- One-Day Options Course
- OptionsPro
- Retirement Income Workshop
- Sure-Fire Trading Systems (VectorVest, Inc.)
- Trading as a Business Workshop
- VectorVest 7 EOD
- VectorVest 7 RealTime/IntraDay
- VectorVest AutoTester
- VectorVest Educational Services
- VectorVest OnLine
- VectorVest Options Analyzer
- VectorVest ProGraphics v6.0
- VectorVest ProTrader 7
- VectorVest RealTime Derby Tool
- VectorVest Simulator
- VectorVest Variator
- VectorVest Watchdog


