

HOT TOPICS LIST
- Strategies
- Stocks
- Buy
- Investing
- Brokers
- Psychology
- Interviews
- Accumulate
- Sell
- Hold
- Spotlight
- Websites
- Candlestick Corner
- Gold & Metals
- Options Trading
LIST OF TOPICS
INVESTING
Inflation-Adjusted Market Returns
09/27/12 09:44:48 AM PSTby Ron McEwan
Often, we forget to take inflation into account when calculating long-term returns. Here's how you can include this necessary variable and get a more realistic picture of your returns.
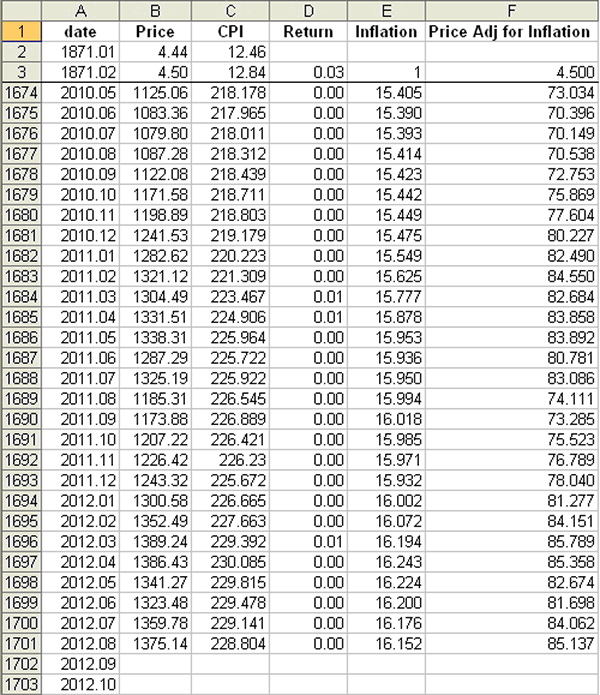
| As I write this, it is mid-September 2012 and the markets are reaching for all-time highs again (for the third time since 2000). Also reaching new highs are the prices of gas, food, and many everyday living necessities. With the indexes at these levels, why does it seem like purchasing value is going down? The talking heads on the business news attribute this to inflation. Does this explain why markets are higher in dollar value and why they seem to be worth less in purchasing value? ADJUSTING FOR INFLATION The spreadsheet (Figure 1) consists of six columns. The first column is the date field. The second is the monthly closing price for the security series being adjusted for Inflation (S&P 500). The third column is the monthly CPI figure. In the following (fourth) column, the return for the month-to-month CPI is calculated as ((this month's CPI minus last month's CPI) divided by
The cumulative rate of inflation is calculated in the fifth column by entering 1 in cell E3 and the formula E3 * (1 + D4) in column E4. Copy this formula down to the end of your data series. The next step, in column F, is to multiply the monthly close (column B) by the cumulative rate of inflation (column E). Again, copy this down to the end of the data series. Your workbook should look like what you see in Figure 1.
FIGURE 1: PRICE ADJUSTED FOR INFLATION. Here you see how you can adjust price for inflation on an Excel spreadsheet.
If you plot columns A (date), B (price), and F (inflation adjustment), you can compare the original price series for monthly closing prices to the data series that was adjusted for inflation over the same period of time. |
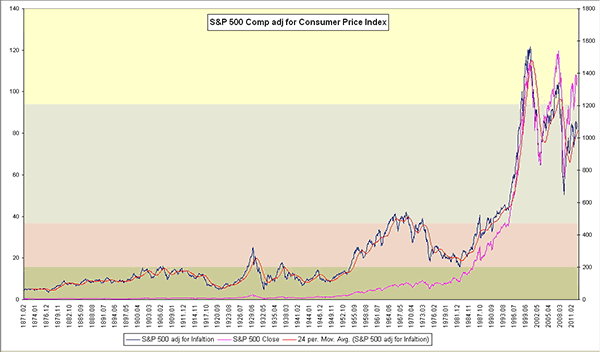
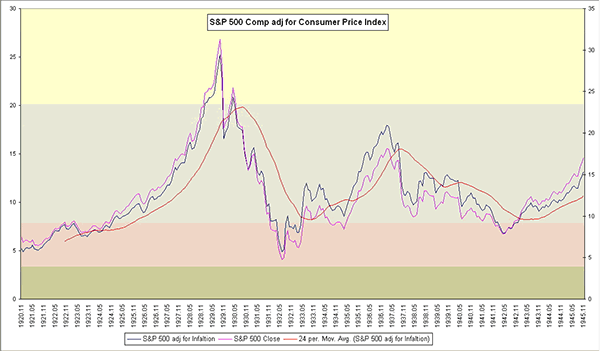
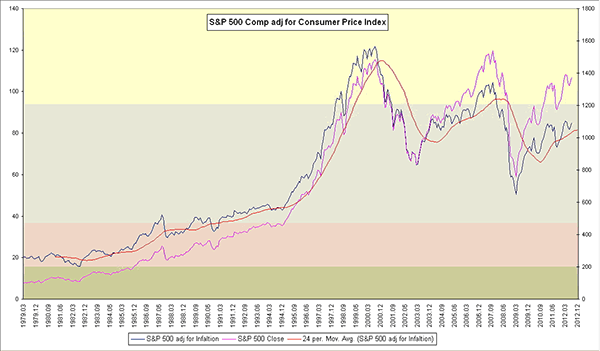
| Figure 2 examines the monthly closing price for the S&P 500 going back to 1871. Figure 3 covers the period for the 1929 market crash. As you can see, inflation kept up with market performance, in up and down moves. In Figure 4, you can see more closely that while the markets are attempting to regain their previous highs, inflation appears to be eroding the value of this move.
FIGURE 2: S&P 500 VS. INFLATION-ADJUSTED PRICE. Here you see the monthly closing prices for the S&P 500 going as far back as 1871.
FIGURE 3: S&P 500 1929 MARKET CRASH VS. INFLATION-ADJUSTED PRICE. Note how inflation kept up with market performance.
FIGURE 4: S&P 500 CURRENT VS. INFLATION-ADJUSTED PRICE. Markets are attempting to regain their previous highs, but inflation appears to be eroding the value of this move. |
| BE CAUTIOUS The current spread between real market prices and inflation-adjusted prices should be viewed as ominous. How this discrepancy eventually resolves itself may not be welcome to long-term investors. |
Ron McEwan is an independent trader and market technician. He may be reached at rmac@juno.com.
| E-mail address: | rmac@juno.com |
PRINT THIS ARTICLE

Request Information From Our Sponsors
- StockCharts.com, Inc.
- Candle Patterns
- Candlestick Charting Explained
- Intermarket Technical Analysis
- John Murphy on Chart Analysis
- John Murphy's Chart Pattern Recognition
- John Murphy's Market Message
- MurphyExplainsMarketAnalysis-Intermarket Analysis
- MurphyExplainsMarketAnalysis-Visual Analysis
- StockCharts.com
- Technical Analysis of the Financial Markets
- The Visual Investor
- VectorVest, Inc.
- Executive Premier Workshop
- One-Day Options Course
- OptionsPro
- Retirement Income Workshop
- Sure-Fire Trading Systems (VectorVest, Inc.)
- Trading as a Business Workshop
- VectorVest 7 EOD
- VectorVest 7 RealTime/IntraDay
- VectorVest AutoTester
- VectorVest Educational Services
- VectorVest OnLine
- VectorVest Options Analyzer
- VectorVest ProGraphics v6.0
- VectorVest ProTrader 7
- VectorVest RealTime Derby Tool
- VectorVest Simulator
- VectorVest Variator
- VectorVest Watchdog