HOT TOPICS LIST
- Strategies
- Stocks
- Buy
- Investing
- Brokers
- Psychology
- Interviews
- Accumulate
- Sell
- Hold
- Spotlight
- Websites
- Candlestick Corner
- Gold & Metals
- Options Trading
LIST OF TOPICS
CHART PATTERNS
Right-Angle Triangles
10/16/12 10:44:11 AM PSTby Bruce Tintelnot
When chart patterns form, they can give you some idea on where prices may be going as they go their own way. Here's the right triangle chart pattern, the two types that form, and what they indicate.
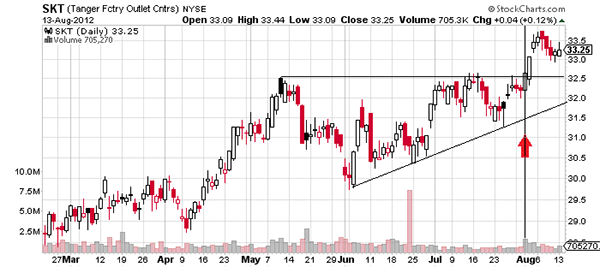
| When market technicians began charting trending markets, they observed that the charts formed recognizable patterns as the bulls or the bears struggled for control of prices. Some of the patterns are consistent with the continuation of a trend and some often indicate a trend reversal. The right triangle pattern, whether it is ascending or descending, is one that most often indicates the continuation of a trend. ASCENDING TRIANGLES This is a robust formation that isn't relegated to any particular trend duration. The upper horizontal line forms a resistance level that is continually tested by buyers. Each failure to break out above the resistance results in a reaction low that is higher than the previous low, indicating the bullishness of the continuation. Usually, volume contracts as the trading range decreases with a surge of activity when the resistance level is actually breached. As usual in technical analysis, the resistance level becomes a support level for the rising prices when the breakout occurs. The daily chart of Tanger Factory Outlet Centers in Figure 1 displays an ascending triangle from May 2012 to August 2012. Prices broke out of this triangle in early August 2012 accompanied with high volume. |
 FIGURE 1: TANGER FACTORY OUTLET CENTERS (SKT), DAILY. Here you see the formation of an ascending right triangle during May through August. These can be seen by the lines connecting the highs and lows. The price breakout at $32.50 was accompanied by an increase in volume at the beginning of August as indicated by the arrow. DESCENDING TRIANGLES |
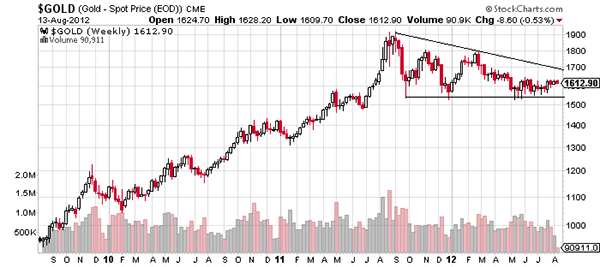
 FIGURE 2: SPOT PRICE OF GOLD, WEEKLY. The spot price of gold formed a descending right triangle beginning in August 2011 that currently continues and looks close to a downward breakout. This formation is also a robust one, and like the ascending triangle, its occurrence isn't limited to the length and duration of the trend. In addition, the volume decreases with the trading range, and like a coiled spring suddenly being released, increases as the support level is broken. TARGET PRICE
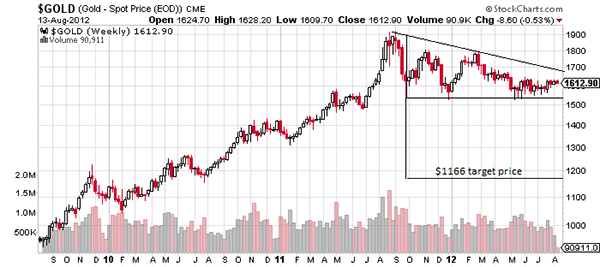
This method would just be reversed for a descending triangle. Another way to do this for people who like working with geometric shapes and rulers would be to invert the perpendicular around the base line. Whichever way you choose to use it, you will end up with similar results. The price target for a breakout in the example for $GOLD would be as seen in Figure 3:
FIGURE 3: MEASURING PRICE TARGETS. In the event of a downward breakout, a price target of $1166 has been calculated, which happens to be very close to a previous support level around $1,200 reached in November 2009 and May through August 2010. |
| CONTINUATIONS Ascending and descending triangles, or right triangles, are robust patterns that usually indicate a continuing trend after a declining trading range runs its course. They can occur regardless of the length or duration of a trend, but a trend must always be present. They are usually accompanied by contracting volume that suddenly increases as they break through the resistance or support levels formed by the base of the triangle. How far the price is going to move cannot be precisely measured, but there are methods that can give you a reasonable target price, especially when technical indicators are also used. |
Bruce Tintelnot is a private trader and freelance writer.
PRINT THIS ARTICLE

|

Request Information From Our Sponsors
- StockCharts.com, Inc.
- Candle Patterns
- Candlestick Charting Explained
- Intermarket Technical Analysis
- John Murphy on Chart Analysis
- John Murphy's Chart Pattern Recognition
- John Murphy's Market Message
- MurphyExplainsMarketAnalysis-Intermarket Analysis
- MurphyExplainsMarketAnalysis-Visual Analysis
- StockCharts.com
- Technical Analysis of the Financial Markets
- The Visual Investor
- VectorVest, Inc.
- Executive Premier Workshop
- One-Day Options Course
- OptionsPro
- Retirement Income Workshop
- Sure-Fire Trading Systems (VectorVest, Inc.)
- Trading as a Business Workshop
- VectorVest 7 EOD
- VectorVest 7 RealTime/IntraDay
- VectorVest AutoTester
- VectorVest Educational Services
- VectorVest OnLine
- VectorVest Options Analyzer
- VectorVest ProGraphics v6.0
- VectorVest ProTrader 7
- VectorVest RealTime Derby Tool
- VectorVest Simulator
- VectorVest Variator
- VectorVest Watchdog

