HOT TOPICS LIST
- Strategies
- Stocks
- Buy
- Investing
- Brokers
- Psychology
- Interviews
- Accumulate
- Sell
- Hold
- Spotlight
- Websites
- Candlestick Corner
- Gold & Metals
- Options Trading
LIST OF TOPICS
INVESTING
Timing And Dollar Cost Averaging
01/04/13 08:13:33 AM PSTby Donald Pendergast
Timing makes a difference.
| Despite the popularity of exchange traded funds, mutual fund investing remains a viable method of building a long-term retirement nest egg, and with millions of investors making regular monthly and/or annual contributions to their IRA or Roth IRA accounts, there is no lack of interest among such investors as to how to maximize the gains that such tax-advantaged accounts can produce over long periods of time. Here's a look at a unique mutual fund --one that has only had a few losing years since it was launched -- and we'll learn how some simple, real-world tactics were able to substantially increase the returns of the fund over the last decade and a half. The Permanent Portfolio Fund (PRPFX) is a no-load mutual fund offered by the Permanent Portfolio Family of Funds that relies on a unique asset-class diversification theory similar to a strategy developed in the early 1970s by famed investment newsletter writer and best-selling financial-markets author Harry S. Browne (1933-2006). After extensive testing, Browne found that a permanent investment portfolio made up of equal allocations from the following four classes of financial instruments was likely to provide long-term protection from the ravages of inflation, while also allowing an investor the ability to capitalize on whichever of the four asset classes were outperforming at any given time:
According to Browne's original concept, this portfolio would initially be funded with 25% of an investor's available capital into each of the four asset classes. Over time, one or more of the classes would begin to out- or underperform the others, necessitating restructuring work. Rebalancing the portfolio back to the initial 25% allocation per asset class was to be performed anytime that one of the asset classes dropped to 15% or climbed above 35% of the portfolio value. This ensured that all asset classes had an equal shot at pulling the overall weight of the entire portfolio, since it was presumed that no one can consistently time the market and/or determine which of the four asset types would be the next big winners (or losers). |
| Numerous studies by Harry Browne and other market technicians have confirmed that the permanent portfolio is sound -- and profitable over the long haul, offering long-term average annual rates of return similar to a broad market Standard & Poor's 500 index fund -- but without the nasty drawdowns (sometimes exceeding 30% or 40% per occurrence) that a stock-only portfolio will typically endure several times over the course of a 40-year window of time. ENTER PRPFX Incredibly, since the fund's launch on December 1, 1982, it has experienced only four losing years -- in 1984, 1990, 1994, and 2008. While it's too early to discern if 2012 will be another winning year for the fund, as of November 16, PRPFX closed at 48.40, up more than 5% from 2011's year-end close of 46.09. With that brief primer on the principles surrounding the philosophy and operation of the fund out of the way, let's see if there might have been a significant advantage in one style of dollar cost averaging over another during the past 16-plus years, beginning on July 1, 1996. TWO PATHS, SAME CAPITAL, DIFFERENT OUTCOME
Additional details:
Method 2 specifics:
Additional details:
LOGICAL ASSUMPTIONS? |
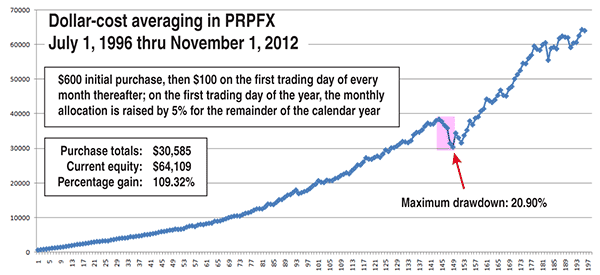
| Without knowing what the results are beforehand, it might seem logical to assume that method 1 might be more adaptive, able to buy into minor dips (in PRPFX's valuation) in a strong bullish trend that the latter method might miss altogether. That the first method also takes inflation into account might also seem to be wise, given the inherent bias toward higher stock and commodity valuations over long periods of time. THE BATTLE BEGINS Method 1 (Figure 1):
FIGURE 1: DOLLAR COST AVERAGING IN PRPFX USING METHOD 1 (JULY 1, 1996 TO NOVEMBER 1, 2012). Method 1 required 196 monthly purchases with a percentage gain of 109.32 and maximum drawdown of 20.90%. Method 2 (Figure 2):
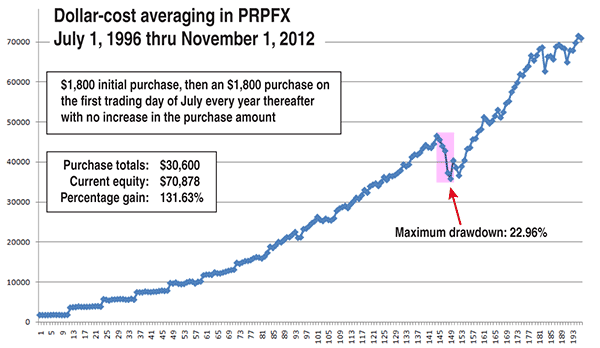
FIGURE 2: DOLLAR COST AVERAGING IN PRPFX USING METHOD 2 (JULY 1, 1996 TO NOVEMBER 1, 2012). Method 2 require 17 purchases with a percentage gain of 131.63 and maximum drawdown of 22.96%. OBSERVATIONS
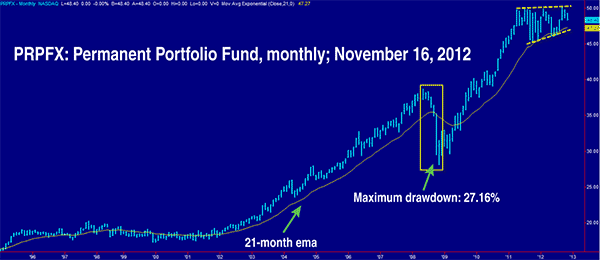
Part of the difference between the returns in both percentage and dollar gains terms appears to be due to the difference in the initial funding amounts: $600 for method 1 and $1,800 for method 2. By establishing a larger initial position in method 2 when PRPFX was at 13.03, you could say that method 2 gained a significant head start over method 1, which took a much smaller initial stake. Another reason for the outperformance of method 2 is likely due to PRPFX trading in a generally sideways range between 1996 and 2001 and instead of progressively increasing the purchase amounts during that period like method 1 did, method 2 simply played it safe, putting in the exact same amount of cash every July. During the powerful rally in the fund between 2002 and mid-2008, method 1 kept its progressively larger purchases even as the fund hit new highs; this also increased the amount of pain during the 27.16% drawdown that PRPFX endured between July 2008 and February 2009 (Figure 3). Finally, for the past 18 months, PRPFX has traded in a fairly wide range. Method 2 always keeps an even keel, simply buying $1,800 every July 1, while method 1 has slowly been increasing its purchase allocation since the consolidation started.
FIGURE 3: PRPFX, MONTHLY. Note the 27.16% drawdown the fund endured between July 2008 and February 2009. Regardless of the underlying reasons for the noticeable outperformance of method 2 versus method 1, it seems clear that making one large purchase per year in PRPFX offers several potential advantages when compared to the results produced by the steady, small purchases made on a monthly basis, as mentioned previously. This backtest also raises new questions. For example, should the purchase allocation of method 2 be periodically increased to help protect against inflation? And if yes, then by how much? Perhaps one simple solution would be to increase the $1,800 allocation by a certain percentage (at its next scheduled annual purchase date) whenever PRPFX experiences a monthly drawdown of 5% or more. Another possible solution could be to increase the initial $1,800 allocation every third year by 5%; this arrangement (method 3) produced slightly less profit than method 2, but still managed to greatly outdistance method 1: |
| Method 3: Net purchases: $35,543 Number of shares: 1,619.05 Number of purchases: 17 Current value: $79,674 Percentage gain: 124.16% Maximum drawdown: (22.96%) Length of max drawdown: Five months (July 1 to December 1, 2008) I'LL TAKE DOOR 3, MONTY
While no one knows if any of these DCA methods into PRPFX will continue to provide similar (if any) profits in the months and years to come, that all three methods did acceptably over the past 16 and a half years should provide some degree of confidence for those who may be inclined to build a long-term position into this uniquely diversified mutual fund. IS PEACE OF MIND POSSIBLE? For long-term investors who can stay the course with one of the dollar cost averaging plans discussed here, the peace of mind obtained by owning a fund that has historically modest drawdowns might be the ticket that gets them started on the road to low-risk, long-term investing success. A spreadsheet to test and find optimum allocations is available for download here. |
Donald Pendergast has studied technical price charts and market dynamics for more than 30 years and has had more than 1,000 articles on technical analysis, trading system development, and high-probability chart setups published at several trading/investing publications since 2008. Pendergast offers real-world trading signals for a basket of eight gold/silver mining stocks/ETFs and also offers high-quality, customized analysis for US stocks. He may be reached at 904 303-4814, at lineartradingsys@gmail.com, or via his website at https://sites.google.com/site/goldandsilverstockssignals/.
| Website: | sites.google.com/site/goldandsilverstockssignals/ |
| E-mail address: | lineartradingsys@gmail.com |
PRINT THIS ARTICLE

Request Information From Our Sponsors
- VectorVest, Inc.
- Executive Premier Workshop
- One-Day Options Course
- OptionsPro
- Retirement Income Workshop
- Sure-Fire Trading Systems (VectorVest, Inc.)
- Trading as a Business Workshop
- VectorVest 7 EOD
- VectorVest 7 RealTime/IntraDay
- VectorVest AutoTester
- VectorVest Educational Services
- VectorVest OnLine
- VectorVest Options Analyzer
- VectorVest ProGraphics v6.0
- VectorVest ProTrader 7
- VectorVest RealTime Derby Tool
- VectorVest Simulator
- VectorVest Variator
- VectorVest Watchdog
- StockCharts.com, Inc.
- Candle Patterns
- Candlestick Charting Explained
- Intermarket Technical Analysis
- John Murphy on Chart Analysis
- John Murphy's Chart Pattern Recognition
- John Murphy's Market Message
- MurphyExplainsMarketAnalysis-Intermarket Analysis
- MurphyExplainsMarketAnalysis-Visual Analysis
- StockCharts.com
- Technical Analysis of the Financial Markets
- The Visual Investor


