

HOT TOPICS LIST
- Strategies
- Stocks
- Buy
- Investing
- Brokers
- Psychology
- Interviews
- Accumulate
- Sell
- Hold
- Spotlight
- Websites
- Candlestick Corner
- Gold & Metals
- Options Trading
LIST OF TOPICS
THE CHARTIST
Swing Trading With Three Indicators
03/29/13 10:03:01 AM PSTby Donald Pendergast
You have to start somewhere.
Thousands of trading systems are available in the marketplace today; some are relatively inexpensive to buy or lease, while others cost several thousand dollars or more. These systems can be based on volatility breakouts, moving average crossovers, neural networks, genetic optimization, oscillators, and linear regression. But no matter how plain or fancy the trading logic is for a system, all that matters are your answers to the following two questions:
If you can honestly answer "yes" to the first two questions, you might also want to ask yourself a third question, which is:
If you answered all three questions honestly, you can learn to become a consistently profitable trader, even if you use a simple system that you can create yourself using standard indicators found in virtually every popular trading/charting platform (and your own eyes). |
| A SIMPLE AND VISUAL SYSTEM Here's a look at my simple, visually based "trading with the trend" system that is nonoptimized, noncurve-fitted and is a no-brainer to construct and maintain. The key ingredient for success in trading with this template is you, because there are no secret market indicators or forecasting tools that can guarantee you trading success. But this no-cost trading template that is easy to construct will help you stay on track with the mental and emotional discipline needed to learn to trade profitably. After that, you may want to further fine-tune it by obtaining education in other market dynamics like relative strength analysis, money management techniques, price cycle studies, or wave analysis. THE RIGHT CANDIDATES UNO, DOS, TRES
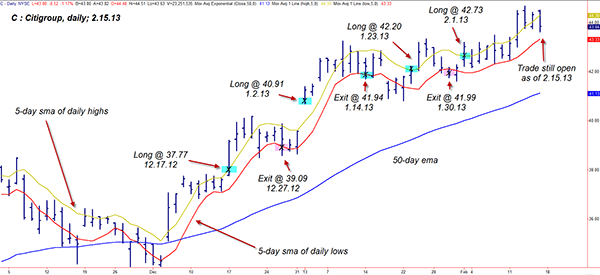
FIGURE 1: THE THREE-INDICATOR TRADING TEMPLATE. In this sample daily chart of Citigroup (C), out of the four most recent long trade entries, two closed out for a gain, one resulted in a small loss, and the last trade is still open, also with a decent gain to date. Taking entries when their direction is aligned with the trend bias of the 50-period EMA seems to be effective in historic testing.
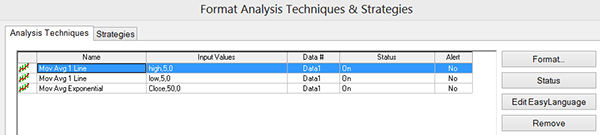
FIGURE 2: FORMATTING YOUR INDICATORS. Here is an example of how you can format your three moving averages. Most popular technical charting platforms also allow for similar customization of the simple and exponential moving averages. The trading logic is very simple: |
Long entry:
Short entry: The rules for short entry are simply the inverse of the long entry setup. PRETTY SIMPLE, HUH? Plot this template on the daily charts of your favorite energy, technology, regional bank, airline, home builder, or precious metals mining stocks and see if you can locate a handful of trading candidates from a variety of diverse sectors with which to trade using this method. If they trend well, keep 'em, if not, ditch 'em and look for a stock that has a long-term history of regular trend moves. That's the beauty of this system; you become the final arbiter of what, when, and how to trade the markets by:
KEEP LEARNING |
| With all of that said, here are a few of the hypothetical results of trading Citigroup with this method since early 2012: Hypothetical Trade Results
The system is currently in a long trade initiated on February 1, 2013 that is up by 3.81% as of the close on February 12, 2013, which is not included in the above statistics. MOVING FORWARD, SLOWLY |
| Of course, this is just a sample trading strategy and no one knows if it will continue to perform as well as this in the future, but you can alter it, fine-tune it, automate it, add multiple exits, or just run it as-is, being sure to select a suitable, diverse universe of stocks or ETFs to trade it with. Try using a longer or shorter EMA as your trend-confirmation line. Consider using, for example, a 21- or 30-day EMA to generate more trading opportunities, or perhaps an 80- or 100-day EMA to slow things down a bit. You can accomplish much of the same thing by lengthening/shortening the moving averages of the daily highs and lows, too. You can even control the dollar/share allocations by limiting your maximum account risk to perhaps 2% per trade or 0.75% to 1% per trade if you are trading it with a portfolio of six or more stocks. The possibilities for further development of this system are limited only by your understanding of the financial markets, trading skills, imagination, creativity, account size, and confidence level. Charts: TradeStation 9.1 (TradeStation Securities) |
Donald Pendergast has studied technical price charts and market dynamics for more than 30 years and has had more than 1,000 articles on technical analysis, trading system development, and high-probability chart setups published at several trading/investing publications since 2008. Pendergast offers real-world trading signals for a basket of eight gold/silver mining stocks/ETFs and also offers high-quality, customized analysis for US stocks. He may be reached at 904 303-4814, at lineartradingsys@gmail.com, or via his website at https://sites.google.com/site/goldandsilverstockssignals/.
| Website: | sites.google.com/site/goldandsilverstockssignals/ |
| E-mail address: | lineartradingsys@gmail.com |
PRINT THIS ARTICLE

Request Information From Our Sponsors
- StockCharts.com, Inc.
- Candle Patterns
- Candlestick Charting Explained
- Intermarket Technical Analysis
- John Murphy on Chart Analysis
- John Murphy's Chart Pattern Recognition
- John Murphy's Market Message
- MurphyExplainsMarketAnalysis-Intermarket Analysis
- MurphyExplainsMarketAnalysis-Visual Analysis
- StockCharts.com
- Technical Analysis of the Financial Markets
- The Visual Investor
- VectorVest, Inc.
- Executive Premier Workshop
- One-Day Options Course
- OptionsPro
- Retirement Income Workshop
- Sure-Fire Trading Systems (VectorVest, Inc.)
- Trading as a Business Workshop
- VectorVest 7 EOD
- VectorVest 7 RealTime/IntraDay
- VectorVest AutoTester
- VectorVest Educational Services
- VectorVest OnLine
- VectorVest Options Analyzer
- VectorVest ProGraphics v6.0
- VectorVest ProTrader 7
- VectorVest RealTime Derby Tool
- VectorVest Simulator
- VectorVest Variator
- VectorVest Watchdog