HOT TOPICS LIST
- Strategies
- Stocks
- Buy
- Investing
- Brokers
- Psychology
- Interviews
- Accumulate
- Sell
- Hold
- Spotlight
- Websites
- Candlestick Corner
- Gold & Metals
- Options Trading
LIST OF TOPICS
TRADER'S NOTEBOOK
Channeling With Elliott Waves
05/14/02 03:52:22 PM PSTby Rudy Teseo
Elliott Wave Tutorial: Part III -- Project upcoming waves with this classic technique.
| Now that you are familiar with some of the many Elliott wave patterns (see Part I and Part II), I'll discuss a means of projecting the course of a wave in development: the channel. Channels are parallel lines that you draw on your stock charts using a trendline-drawing tool. If you are studying Elliott wave principles but don't have a charting program, you can also construct these channels on commercial stock charts, such as daily charts, or on graph paper. Be sure to use semi-log scales on your computer charts, and use semi-log graph paper if you are drawing your own charts.
ADVANTAGES OF CHANNELSChanneling helps you keep waves of the same degree together, and it allows you to project the next reversal point. The method is not as accurate as using the mathematical computations I will discuss in part IV. Channeling only gives you a boundary for the completion of the wave, but where the wave actually ends is a function of time. The longer the wave is in development (in a rising channel), the higher the reversal price will be. The channel cannot help you project an exact price; it is only meant to enclose all the waves of the same degree together. When a channel you're constructing doesn't seem to be doing what you expect, it may be a warning that your wave count is incorrect. Remember, in part I, I emphasized the caveat from A.J. Frost and Robert Prechter's Elliott Wave Principle that an incorrect wave count will lead to erroneous projections. Many chartists wait until wave 3 is complete and then draw a channel to project wave 4. However, it is helpful to start a channel as soon as wave 2 is complete, and in that way project wave 3. Remember, wave 3 is usually the longest, so instead of waiting around and wondering where it will end, you can get a head start, monitoring your chart as the stock or index unfolds. If price pierces the channel, it may be an indication that wave 3 will be a long or extended wave. You can review extended waves in part II.
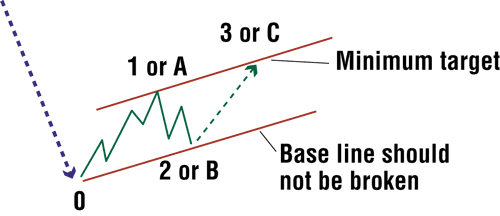
Target for wave 3 (Figure 1): As soon as wave 2 completes and reverses, draw a trendline from the origin of wave 1 through the end of wave 2, as shown in Figure 1. Then construct a parallel from wave 1, which will be the boundary for completion of wave 3.
Figure 1: Channel for wave 3
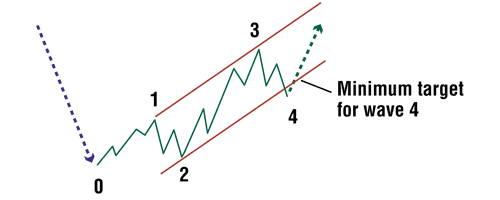
Target for wave 4 (Figure 2): When wave 3 completes and reverses, draw a trendline connecting waves 1 and 3. Then construct a parallel from wave 2. This will be the minimum target for wave 4. If this wave ends appreciably short of the boundary line, examine the developing pattern carefully. Is it possible that this is really W2 of W5 of W3? This is the kind of analysis that is required as patterns develop.
Figure 2: Channel for wave 4
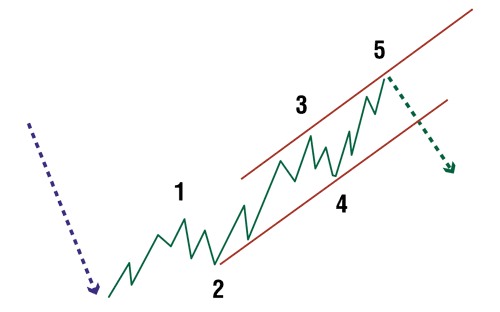
Target for wave 5 (see Figure 3): When wave 4 completes and reverses, draw a trendline connecting waves 2 and 4. Then construct a parallel from wave 3. This will be the boundary for wave 5. If it ends appreciably short, it may be a truncated fifth.
Figure 3: Channel for wave 5
Target for wave 5 (alternate) (Figure 4): In the case where wave 3 is an extended wave and goes outside the normal channel, you will need to construct a parallel from wave 1 rather than from wave 3. This will give you a more realistic boundary for W5.
Figure 4: Channel for wave 5 with wave 3 extended
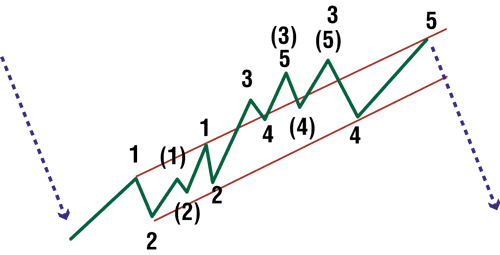
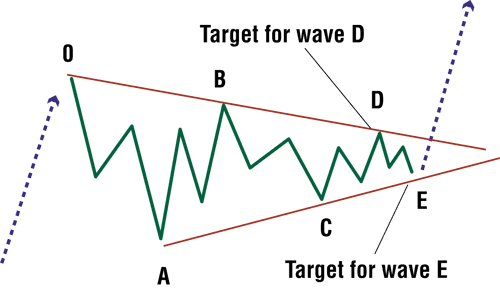
Targets for waves in leading or ending diagonals (Figure 5): Diagonals are part of motive waves, and although the boundary lines of the pattern are not parallel, we consider them channels for the purpose of projecting succeeding waves. As soon as you consider a wave A or B to be completed, draw a trendline from the origin of wave A (which will be the end of a wave C or a wave 4) through the end of wave B. This will be the boundary of wave D, if in fact you are in a diagonal (you can't be sure until wave C has completed). Then draw a trendline from wave A through the end of wave C, and you will have a boundary for wave E.
Figure 5: Channel for diagonals
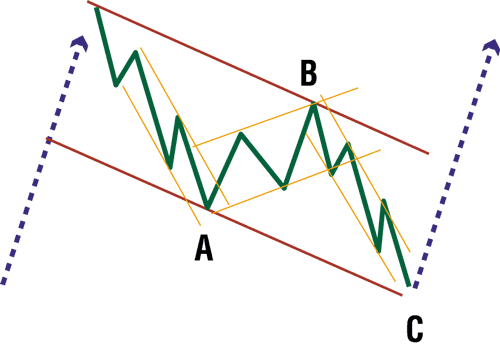
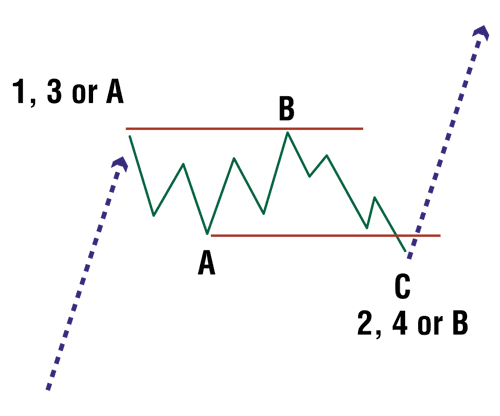
Targets for waves A, B, and C (Figures 6 and 7). Targets for corrective waves are not as straightforward as for motive waves, which I discussed in part II. In a zigzag or a flat pattern, you can draw a trendline from the origin of wave A through the end of wave B, and then construct a parallel from wave A to target wave C. This will also work for zigzags and flat spots in combination waves. However, triangles and expanded or running flats do not fit well into channels. Note in Figure 6 how channels are used to project each wave within the zigzag.
Figure 6: Channels for zigzag and subwaves
Figure 7: Channel for flat pattern
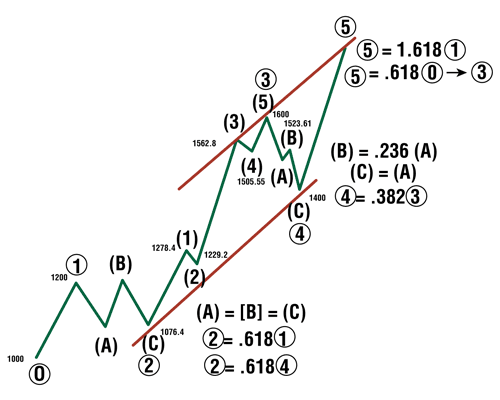
Idealized EW pattern and channel (Figure 8). Figure 8 illustrates an Elliott wave pattern resulting from idealized Fibonacci ratios and retracements and fits perfectly into a channel. It's very rare to come across something that fits this perfectly. All the ratios shown will be explained in detail in part IV.
Figure 8: Idealized Elliott wave pattern
In part IV, I will explain all the ratios and put all the Elliott wave theories I have discussed so far into practical application.
Rudy Teseo has taught courses in option trading and the basics of stock charting. Contact him at rftess@juno.com.
The patterns in Figures 1-7 are presented through the courtesy of Prognosis Software Development and its website, www.elwave.com. Figure 8 is from Elliott Wave Principle. Reprinted with permission.
SUGGESTED READINGFrost, A.J., and Robert Prechter [1985]. Elliott Wave Principle, New Classics Library.Prognosis Software Development, www.elwave.com, email: info@prognosis.nl. Teseo, Rudy [2002]. "Counting Elliott Waves: Elliott Wave Tutorial, Part I," Working Money: May. _____ [2002]. "Recognizing Elliott Waves: Elliott Wave Tutorial, Part II," Working Money: June.
Current and past articles from Working Money, The Investors' Magazine, can be found at Working-Money.com.
|
Rudy Teseo is a private investor who trades stocks, options, and currencies. He has taught classes in technical analysis and option trading. He may be reached at rftess@optonline.net.
| E-mail address: | rftess@optonline.net |
PRINT THIS ARTICLE

Request Information From Our Sponsors
- StockCharts.com, Inc.
- Candle Patterns
- Candlestick Charting Explained
- Intermarket Technical Analysis
- John Murphy on Chart Analysis
- John Murphy's Chart Pattern Recognition
- John Murphy's Market Message
- MurphyExplainsMarketAnalysis-Intermarket Analysis
- MurphyExplainsMarketAnalysis-Visual Analysis
- StockCharts.com
- Technical Analysis of the Financial Markets
- The Visual Investor
- VectorVest, Inc.
- Executive Premier Workshop
- One-Day Options Course
- OptionsPro
- Retirement Income Workshop
- Sure-Fire Trading Systems (VectorVest, Inc.)
- Trading as a Business Workshop
- VectorVest 7 EOD
- VectorVest 7 RealTime/IntraDay
- VectorVest AutoTester
- VectorVest Educational Services
- VectorVest OnLine
- VectorVest Options Analyzer
- VectorVest ProGraphics v6.0
- VectorVest ProTrader 7
- VectorVest RealTime Derby Tool
- VectorVest Simulator
- VectorVest Variator
- VectorVest Watchdog

