HOT TOPICS LIST
- Strategies
- Stocks
- Buy
- Investing
- Brokers
- Psychology
- Interviews
- Accumulate
- Sell
- Hold
- Spotlight
- Websites
- Candlestick Corner
- Gold & Metals
- Options Trading
LIST OF TOPICS
THE CHARTIST
Fibonacci Retracements And Pivots
07/30/02 03:31:47 PM PSTby Dennis D. Peterson
You'll have better success placing Fibonacci retracement levels if you pay attention to your pivot points.
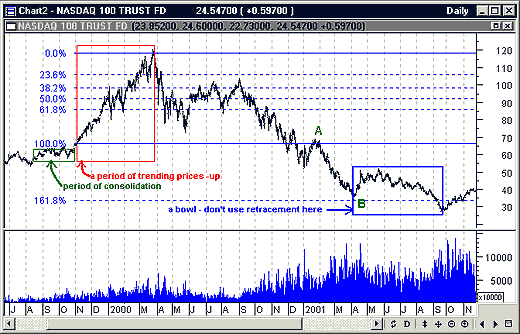
| Have you given up on Fibonacci retracements because they don't always work? Maybe it's time to examine where and when you are placing the levels. It may be that you are not paying enough attention to the highs and lows of the pivots you are using, or you may be forgetting that retracements work best with trends. I don't have a magic formula for placing Fibonacci retracements, but I can give you some examples to help you apply them better. First, let's make sure we are on the same page when we're talking about Fibonacci retracements. (For a definition of pivots, see my article "What Are Pivots?" A Fibonacci retracement is a device used by traders to determine where support and resistance might be found after price has gone through a top and then a bottom or vice versa. I am referring to trends; I wouldn't use retracements on bowl or saucer patterns, for example, simply because the pattern already contains the retracement (Figure 1).
Figure 1: Retracement levels. Here, the start of the Fibonacci levels was selected after the consolidation period (green box), and the pivot high was the high point. Retracement projections include three pivot highs at the 38.2% level, but a significant dip below 61.8% in late May indicates that the preceding uptrend wasn't all that strong. Points A and B mark the beginning and end of a downtrend, coincidentally at the 100% and 161.8% levels. When you look at a chart, the first thing you want to do is find a clear trend. From late October 1999 to late March 2000 there was a clear uptrend (Figure 1: red square) in the QQQ. I opted to put the bottom at the end of a consolidation (Figure 1: green square), and the top was an easy pivot high choice, although some refinements will be needed (I'll get to that shortly). Once the 0% and 100% levels are selected, the rest is just a matter of reading what happens. Are you surprised that 161.8% turns out to be a pivot for a significant turn in price nearly a year later? It sometimes happens, though I wouldn't put too much emphasis on this kind of prediction. It was also a little spooky that a downtrend started at point A, at the 100% level, and then stopped at point B, the 161.8% level. I find it hard to believe that events that took place a year before can still affect current market action. If someone has an explanation, I'd like to hear it. When working with retracement levels, you are looking for the action of price following the top. In Figure 1, the retracement went below 61.8%, with the biggest dip in late May 2000. This says the preceding uptrend wasn't all that strong. I remember the pundits talking incessantly about the bubble prior to May 2000, wondering when it was going to burst. I thought it would probably break with a double or triple top, after which it would be a matter of seeing how the retracements go. But all you heard from the analysts was babble about the bubble. Maybe they should go watch Lawrence Welk.
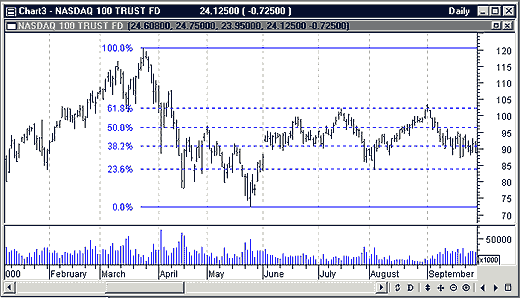
REFINING THE TECHNIQUETo select an appropriate top to place the 100% line or level and an appropriate bottom to place the 0% retracement line, I selected the downtrend following the uptrend in Figure 1. Note from Figure 2 relative to Figure 1, I switched the placement of the 100% and 0% levels. This choice may look fine, but it is sloppy. Why? It could mean I would miss some trades I should take.
Figure 2: Selecting top and bottom points of retracement levels. Fibonacci retracement levels are selected by picking the high of a pivot high bar (March 2000) and the low of a pivot low bar (May 2000). While the Fibonacci levels may look acceptable to you with this expansion, you want to make some refinements for trading purposes.
The essence of trading is buying support and selling resistance, so it behooves traders to find those levels. That's what retracement analysis is all about. Some may suggest jumping on the trend and pyramiding as you see prices stay above or below a moving average. The risk in this kind of venture comes when you mistake a reversal for a reaction, or identify a reversal as a temporary rally. In either case, you should stay in your current position when you should be getting out. Knowing where resistance and support lie, and the strength of that resistance and support, is the essence of trading. I qualified the top and bottom as "appropriate." I will use Figure 3 to show what I meant by that term. In late May, I can see it is time to try to find support and resistance, and to do that I will look to Fibonacci levels.
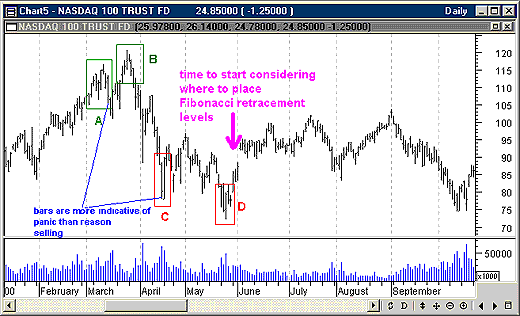
Figure 3: Selection process. Two tops, A and B, and two bottoms, C and D, are potential candidates for retracement analysis. The better choice is almost always the pivot that is not representative of extreme behavior, such as exhausts or panic selling. B and D are the better choices. Remember to wait for top and bottom confirmation before using Fibonacci retracements.
I have identified two tops, A and B, and two bottoms, C and D. What I don't like about A and C are the long price bars, which are evidence of panic selling. I don't want to place a retracement level using an abnormally long price bar, because I may be using someone's mistake. It appears somebody either ended up paying too much or sold too soon. Areas B and D are better choices, not only because the daily bars leading up to and following the pivot bars of each are more reasonable in length, but also because they lead to a better Fibonacci retracements (see Figure 4).
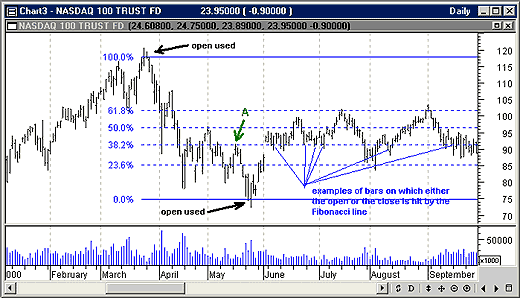
Figure 4: Daily QQQ price and volume for 2000. Excluding the extremes in the price bars and using the opening prices results in retracement values that are tight enough to be used to sell support in the retracement following the downtrend from March through May 2000. One caution is that using Fibonacci levels in September 2000 based on prices from March through May is risky. The risk is mitigated because at $91 there is recent history of price action. Pivot A is a strong enforcing event, along with the gap up for support at the 38.2% level.
Compare where the 38.2% level lines up relative to the opens and closes on Figure 4 versus Figure 2. The 38.2% Fibonacci line of Figure 4, which may be used for finding support through June, is closer to the open and closes of daily bars than the same line on Figure 2. As a bonus (Figure 4: point A), at the 38.2% retracement level, a pivot high, which was resistance, becomes support as price gaps up at the beginning of June. Remember the rule about resistance becoming support once broken? You can see that clearly in this example. Since retracements are relative to trends, you need to be skeptical as price moves sideways and gets farther away from the top and bottom used in the retracement. You also want to look at the retracement to get an idea of the strength of the preceding trend. If you have a strong uptrend, you would expect the retracement to go only to 38.2% and not 61.8%. Similarly, if support in a downtrend only appears at the 38.2% level, as opposed to 50% or 61.8%, any rallies are going to lack strength (Figure 4).
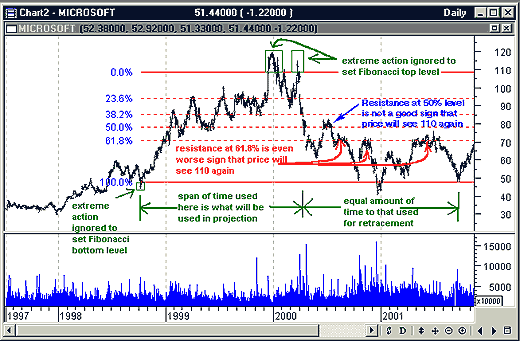
PUTTING ALL THE PIECES TOGETHERFirst, choose a period of time with a trend. From Figure 5 you can see that from late 1998 to 2000, Microsoft (MSFT) went from $48 to $119. The last part of the move up occurred in just a few bars of trading. Therefore, I will remove that extreme overbuying behavior. I also remove some panic selling from the bottom. I am comfortable that I have chosen an uptrend, even if it is bumpy in getting from the bottom to the top. It's not a classic accumulation shape, nor a comfortable, mildly upsloping trend, but it's still an uptrend.
Figure 5: Retracements in action. Using some discrimination in selecting tops and bottoms results in retracement levels that aggressive traders can use to make significant profits. At 61.8% resistance is met, and the downswings are strong enough to make significant profits several times.
My starting point was just after a consolidation. While I could go back further, I am concerned that going back too far might show levels with little value. I want something relatively recent. Next, I note the time span I am covering, going from top to bottom, and project forward the same length of time as a reasonable expectation for valid retracements. What you see happening after the second top is not unexpected. The late 1999 move up was at an unsustainable rate; it had all the appearances of imminent exhaust, and a correction had to be expected. You now want to see where support or resistance will form, and for this you use Fibonacci levels. Resistance is at the 50% level and not at 38.2%, which does not bode well for getting back to a price of $110. Nor is having also missed 23.6% a good sign. If you are an aggressive trader, you may be thinking you might want to sell at 61.8%. This trade would make a bundle, with fills in August and November 2000, and then again in May through June 2001. Each of these shorts will make $20 per share of profit. The math is easy on this one.
SUMMARYWhen using Fibonacci retracements, the first thing to look for is a trend retracement. Once that's your goal, the next step is to identify resistance and support. Next, pick tops and bottoms that don't include extreme behavior; don't expect future price behavior to be based on a few erroneous bars. Finally, identify how much price moves away from the top or bottom, because this is a measure of the trend strength. A strong trend will have small retracements, while a weak one will have large retracements. Remember, your goal is to buy support and sell resistance. Sometimes it pays to be aggressive.
Dennis Peterson may be reached at DPeterson@Traders.com.
SUGGESTED READINGPeterson, Dennis [2002]. "What Are Pivots?" Working Money: February.MetaStock (Equis International), eSignal (data)
Current and past articles from Working Money, The Investors' Magazine, can be found at Working-Money.com.
|
Market index trading on a daily basis.
| Title: | Staff Writer |
| Company: | Technical Analysis, Inc. |
| Address: | 4757 California Ave SW |
| Seattle, WA 98116-4499 | |
| Phone # for sales: | 206 938 0570 |
| Fax: | 206 938 1307 |
| Website: | working-money.com |
| E-mail address: | dpeterson@traders.com |
Traders' Resource Links | |
| Charting the Stock Market: The Wyckoff Method -- Books | |
| Working-Money.com -- Online Trading Services | |
| Traders.com Advantage -- Online Trading Services | |
| Technical Analysis of Stocks & Commodities -- Publications and Newsletters | |
| Working Money, at Working-Money.com -- Publications and Newsletters | |
| Traders.com Advantage -- Publications and Newsletters | |
| Professional Traders Starter Kit -- Software | |
PRINT THIS ARTICLE

Request Information From Our Sponsors
- StockCharts.com, Inc.
- Candle Patterns
- Candlestick Charting Explained
- Intermarket Technical Analysis
- John Murphy on Chart Analysis
- John Murphy's Chart Pattern Recognition
- John Murphy's Market Message
- MurphyExplainsMarketAnalysis-Intermarket Analysis
- MurphyExplainsMarketAnalysis-Visual Analysis
- StockCharts.com
- Technical Analysis of the Financial Markets
- The Visual Investor
- VectorVest, Inc.
- Executive Premier Workshop
- One-Day Options Course
- OptionsPro
- Retirement Income Workshop
- Sure-Fire Trading Systems (VectorVest, Inc.)
- Trading as a Business Workshop
- VectorVest 7 EOD
- VectorVest 7 RealTime/IntraDay
- VectorVest AutoTester
- VectorVest Educational Services
- VectorVest OnLine
- VectorVest Options Analyzer
- VectorVest ProGraphics v6.0
- VectorVest ProTrader 7
- VectorVest RealTime Derby Tool
- VectorVest Simulator
- VectorVest Variator
- VectorVest Watchdog

