HOT TOPICS LIST
- Strategies
- Stocks
- Buy
- Investing
- Brokers
- Psychology
- Interviews
- Accumulate
- Sell
- Hold
- Spotlight
- Websites
- Candlestick Corner
- Gold & Metals
- Options Trading
LIST OF TOPICS
TRADER'S NOTEBOOK
Z-Score Indicator
10/29/02 09:27:44 AM PSTby Veronique Valcu
Here's another look at Bollinger Bands.
| While researching for my math class, I came across z-score and its definition. Suddenly, references to "mean" and "standard deviation" suggested a possible relation with the well-known Bollinger Bands. Is there any other way to look at these bands? Can trades be made using z-score as an indicator? I decided to find out. In this article, I will try to respond to these questions. The z-score (z) for a data item x measures the distance (in standard deviations σ) and direction of the item from its mean (μ):
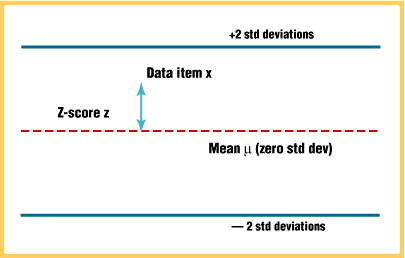
A value of zero indicates that the data item x is equal to the mean μ, while positive or negative values show that the data item is above (x>μ) or below (x<μ) the mean, respectively. Values of +2 and -2 show that the data item is two standard deviations above or below the chosen mean, respectively, and over 95.5% of all data items are contained within these two horizontal references (see Figure 1).
Figure 1: Z-score indicator. Over 95.5% of all data are contained within + and -2 standard deviations.
CALCULATION OF Z-SCOREHow can you apply this formula to stock prices? If you substitute x with the closing price C, the mean μ with simple moving average (SMA) of n periods (n), and σ with the standard deviation of closing prices for n periods, the above formula becomes:
(Computation of z-score, using Excel and MetaStock, for a series of closing prices, is explained in the sidebar, "Z-score calculation.")
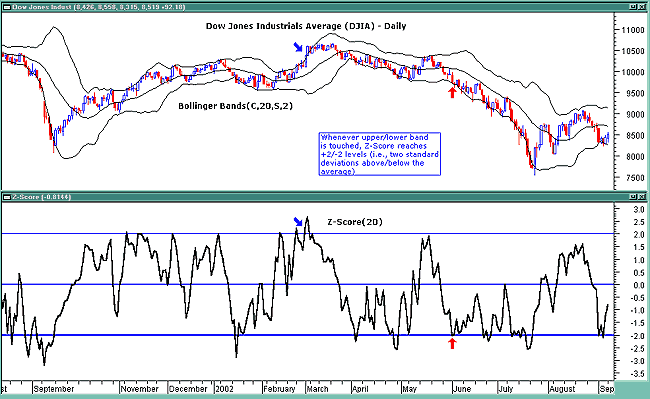
HOW TO USE THE Z-SCORE INDICATOROnce the indicator is defined, the question is "What is the relationship between z-score and the well-known Bollinger Bands?" While Bollinger Bands applied to closing prices are displayed as D standard deviations above and below the mean, z-score shows how far the current closing price is from these bands. Figure 2 displays Bollinger Bands for closing prices (20 periods and two standard deviations) and z-score for 20 days applied to the daily chart of the Dow Jones Industrial Average (DJIA).
Figure 2: Bollinger Bands and z-score. When prices touch the bands, the z-score reaches +2 or -2 standard deviation levels.
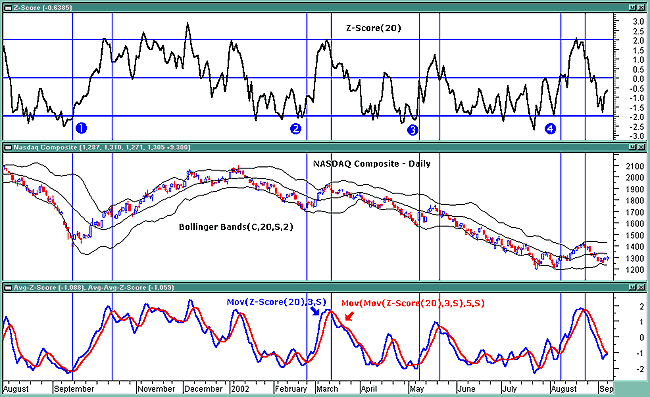
As expected, whenever the price touches the top band, the z-score reaches the +2. Conversely, when price touches the lower band, the z-score reaches -2 standard deviation levels. In Figure 3 (top chart) you see the z-score indicator applied to the Nasdaq composite index. The horizontal levels at +2, 0, -2 offer a clear picture of expected resistance and support levels, as they are equivalent with top Bollinger Band, moving average, and bottom Bollinger Band, respectively.
Figure 3: Smoothing the z-score. This can result in very profitable trades.
Z-score applied to closing prices is an irregular curve that can be smoothed by applying moving averages. In Figure 3 (bottom chart), a simple three-day moving average has been applied to the z-score (20), and a simple five-day moving average is applied to the resulting average. As you can see, good long tradable moves took place at:
·Point 1 (09/21/01 10/17/01) ·Point 2 (2/25/02 3/12/02) ·Point 3 (5/8/02 5/21/02) ·Point 4 (8/8/02 8/23/02)
when the three-day simple moving average crossed above the five-day simple moving average of the three-day simple moving average. Note there are some good shorting opportunities initiated when the three-day simple moving average crossed below the five-day simple moving average of the three-day simple moving average (3/12/02, 04/22/02, 5/21/02, and 8/23/02).
CONCLUSIONSThe z-score indicator is not new, but its use can be seen as a supplement to Bollinger Bands. It offers a simple way to assess the position of the price vis-à-vis its resistance and support levels expressed by the Bollinger Bands. In addition, crossings of z-score averages may signal the start or the end of a tradable trend. Traders may take a step further and look for stronger signals by identifying common crossing points of z-score, its average, and average of average. In order to improve performance, traders can use different periods for the bands together with other periods for the moving averages.
Veronique Valcu is a senior at the American School of Paris, France, with an interest in the financial markets. REFERENCESAchelis, Steven B. [1995]. Technical Analysis From A To Z, Irwin Publishing.Elder, Alexander [1993]. Trading For A Living, John Wiley & Sons. Evens, Stuart P. [1999]. "Bollinger Bands," Technical Analysis of STOCKS & COMMODITIES, Volume 17: March. Murphy, John J [1999]. Technical Analysis Of Financial Markets, New York Institute of Finance. www.animatedsoftware.com, Internet Glossary of Statistical Terms www.thinkquest.org, ThinkQuest: Internet Challenge Library TC2000 (data), MetaStock (Equis International)
SIDEBAR: Z-SCORE CALCULATIONThe Z-score formula applied to closing prices is
In this example, n = 20 days, but other periods can be used. Here is the calculation written for an Excel spreadsheet where n = 20 periods (daily bars). Closing prices are shown in column B for the Nasdaq Composite between July 1 and August 30, 2002. In cell C21, compute the simple moving average for the first 20 closing prices:
=Sum(B2:B21)/20
In cell D21, the use of the Excel function STDEVP (standard deviation) defines the standard deviation of closing prices for the first 20 days:
=STDEVP(B2:B21)
In cell E21, insert the Z-score formula as:
=((B21-C21)/D21).
Copy formulas in C21, D21, and E21 down to the bottom of the last row of the columns. The final Z-score results appear in column E. Values in this column can be plotted easily to visualize the Z-score indicator.
You can download the spreadsheet here.
To create the same indicator using MetaStock 6.52, select Indicator Builder from Tools, select "New," assign "Z-score" as Name and enter the following code:
Periods:=Input("Enter Periods",5,21,20); {number of periods used, in this case 20} a := (C-Mov(C,Periods,S))/ Stdev(C,Periods ) ; {define Z-Score } a; {plot Z-Score}
Press OK to save this code. You are now ready to apply this indicator to any selected chart. V.V.
Current and past articles from Working Money, The Investors' Magazine, can be found at Working-Money.com.
|
PRINT THIS ARTICLE

|

Request Information From Our Sponsors
- StockCharts.com, Inc.
- Candle Patterns
- Candlestick Charting Explained
- Intermarket Technical Analysis
- John Murphy on Chart Analysis
- John Murphy's Chart Pattern Recognition
- John Murphy's Market Message
- MurphyExplainsMarketAnalysis-Intermarket Analysis
- MurphyExplainsMarketAnalysis-Visual Analysis
- StockCharts.com
- Technical Analysis of the Financial Markets
- The Visual Investor
- VectorVest, Inc.
- Executive Premier Workshop
- One-Day Options Course
- OptionsPro
- Retirement Income Workshop
- Sure-Fire Trading Systems (VectorVest, Inc.)
- Trading as a Business Workshop
- VectorVest 7 EOD
- VectorVest 7 RealTime/IntraDay
- VectorVest AutoTester
- VectorVest Educational Services
- VectorVest OnLine
- VectorVest Options Analyzer
- VectorVest ProGraphics v6.0
- VectorVest ProTrader 7
- VectorVest RealTime Derby Tool
- VectorVest Simulator
- VectorVest Variator
- VectorVest Watchdog


