

HOT TOPICS LIST
- Strategies
- Stocks
- Buy
- Investing
- Brokers
- Psychology
- Interviews
- Accumulate
- Sell
- Hold
- Spotlight
- Websites
- Candlestick Corner
- Gold & Metals
- Options Trading
LIST OF TOPICS
THE CHARTIST
The Critical Head & Shoulders Test
11/12/02 04:02:28 PM PSTby Matt Blackman
One of the most reliable chart patterns is the venerable head and shoulders. The markets are set to put this technical mainstay to the test once more. If it passes, the bears will roar. If it fails, get ready for a stampede of the bulls. Either way, is it something you can afford to ignore?
| As rallies go, the latest [OctoberNovember 2002] has been most interesting, if only because it has attracted the loudest calls of a bottom from market professionals. But it is the sixth rally since the current bear market officially began in March 2000, and each has been called "the" bottom by a fair share of experts. With all the talk of a turning point, few appear to have noticed that markets are at a pivotal juncture. Even fewer seem to be aware that a number of major indexes are giving the same signals at similar relative resistance levels, which will test the resolve of the current rally. Like Punxsutawney Phil on Groundhog Day, the markets' reactions to this event will provide valuable insight into whether there will be six more years of bearish winter or if spring and the bulls are just around the corner.
YOUR FRIEND IN TRENDThe markets have been in a downtrend since mid- to late 2000. Much has been written about how to identify trends, but if you are unsure, the best way to see them is to ask an eight-year-old. Put a chart in front of a youngster and ask him or her which way the stock is heading. They get it right every time. So if identifying a trend is so easy, why do so many investors continue to go long in a downtrend? Maybe they don't know any children. It's also amazing how many experts on financial programs don't seem to know any second-graders, because they continue to advise averaging down or trying to pick a bottom in equities that are obviously headed for the basement. A bear market or downtrend is a series of lower highs and lower lows that "is assumed to be [and will remain] in force until the weight of evidence proves otherwise," according to analyst Martin Pring. Put another way, for those who remember Sir Isaac Newton's law of inertia, a body (or security) will resist any alteration in its state of motion or direction. To paraphrase another law of physics (also from Newton), the direction in which a security is moving cannot change unless there is sufficient force applied to it. There must be an overwhelming change in investor sentiment and fundamentals for the markets to change direction. This paradigm shift rarely happens in a few days; it can take months or, in some cases, years. So is there sufficient evidence to call this latest rally a change in trend?
FEELIN' LUCKY?The right side of the chart of the Standard & Poor's 500 in Figure 1 demonstrates a downtrend as evinced by the lower highs and lower lows, and the downtrend will remain in force until sufficient force is applied to reverse it. For that, a series of higher highs and higher lows must occur. In the process, resistance levels must be broken and new levels of support formed. For such things to happen, enough investors must feel confident enough to take their hard-earned money and buy stock. The investors who want to buy the stock must outnumber those who wish to sell. As the stock moves up, those who get left behind kick themselves for missing the opportunity, and vow to jump in on the next retracement. As the stock pauses on profit-taking or consolidation, those investors who missed the first move see their opportunity and ante up. At that point, an uptrend has begun. Technicians looking at a chart can draw a trendline along the bottom of the price movement that touches and then resists the line over at least two or more points. The cycle repeats itself until a new equilibrium is met, so the number of buyers equals the number of sellers. This entire process and uptrend assumes that the economy is strong or looking stronger, employment is up, and consumer spending is causing companies to increase capital expenditures in new equipment, personnel, and raw materials as inventories drop. Most of all, it assumes that investors are confident enough to trade hard-earned money for stock certificates.
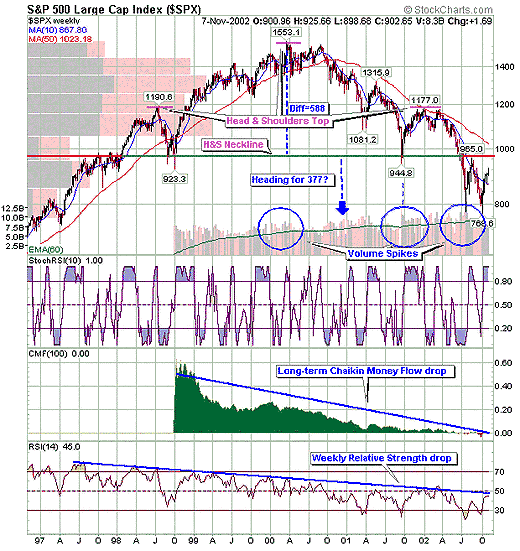
Figure 1: Weekly chart of the S&P 500 Index showing the head and shoulders top pattern.
In examining Figure 1 and keeping the definition of trend in mind, it is clear that the most recent rally at the far right is still part of a downtrend. Before it can be called a bottom, a higher low and higher high must take place, and a new level of support must be set. A crucial part of establishing a new trend will be for price to break up through the level of resistance at 965 (green and red line) and stay above it. Three possible outcomes exist as the index moves from where it is currently: The existing downtrend could continue, a series of new highs and lows could be set to establish a new bull trend, or the index could experience a false breakout above 965, only to fall back again to make another new low. To avoid falling into this bear trap, traders are best advised to wait for confirmation. The index should set a new higher low, pass its previous high, and push up and stay above the 965 resistance level before a new trend can be confirmed.
PSYCHOLOGY BEHIND THE HEAD & SHOULDERSCalled reversal patterns if they fulfill a set of conditions, the head and shoulders top or bottom (inverse) patterns are perhaps the best-known and most reliable formations and can provide some very useful data. Both are considered more powerful when supported by other indicators such as stochastics or the relative strength, money flow, or commodity channel indexes. The head and shoulders top patterns in Figure 1 and Figure 2 suggest that the bull market that existed in the 1990s is over and that the bears have taken over. Since most of you are painfully aware of this, I won't belabor the point. But it is important to understand the market psychology behind it. After moving up for a number of years, the first (left) shoulder drops from 1190 to 920 in Figure 1. This is the largest drop in more than two years and comes at a time when bull sentiment is running high. Investors who missed the last move take the opportunity to buy stock, sending the index back up again. This process occurs again several times (which is why stock charts never move in a straight line), but the number of investors buying stock begins to drop. The number of sellers increases as the price slope flattens. Bulls still outnumber bears as the index hits its high at 1553 (the head). Then price drops, but the bulls still pile in on weakness, and the high is again tested. The second time, the index fails to reach the previous high, and the bulls begin to look around to see what has happened to their ranks. At that point, bulls and bears are equal in number, and the index has entered a trading range. Those who bought the stock have fewer buyers to sell to, so they begin to drop their asking price. This works, but investors start to take losses. (Technical traders began seeing signs that the bull was running out of steam as early as 1996, as the Chaikin money flow indicator began to show that money was leaving the markets.) Sensing a bargain, Johnny-come-latelies, who have been listening to sell-side fundamental analysts working at brokerage houses, buy the stock, only to realize the next buyer won't pay a profit, so they must sell at cost or a loss. Bears begin to smell blood, so they borrow stock to sell short, increasing the number of sellers and driving the price down further. The trading range is over, and the process begins again in earnest — but in the opposite direction. A significant lower low occurs on October 16, and a lower high on November 3, 2000. This transition from bull to bear has taken nine months. Market sentiment has changed, along with the prognosis for the economy and job prospects. The difference is that now the bears are in control. Refusing to believe the bull market is over, stubborn bulls continue to take advantage of market drops by buying, because they think they are buying bargains. But the number of sellers continues to outbid the buyers. The bid drops further. Large drops occur, but recalcitrant bulls continue to buy perceived bargains. Shorts sell into each rally. Then the index takes its biggest drop in a while to 944 as the right shoulder begins to form. Yet again, bargain hunters move in, but the bears short with greater force into the ensuing rally. The top of the right shoulder forms as resistance is hit at about the same level (around 1180) as the left shoulder. Then the market drops out again, weighed down by the shorts and more bad news. With each rally, there is something to celebrate — such as good earnings or economic reports — but each time, bad news and the bears return. Each significant high is lower than the previous high, and each low is lower than the last. Every time there is a rally, mutual fund and brokerage talking heads predict that this is the bottom. But each time the market drops lower, investor skepticism increases. Governments have been taking action to drop interest rates in an effort to shore up consumer and investor confidence. Some actions work better than others, but markets continue their downward march. The right shoulder is now formed and the market drops further, then moves up to test the neckline resistance level at 965 — but fails. It may test it again and fail. The head and shoulders top pattern is now complete. Technicians can now perform a post-mortem. The distance from the neckline up to the head says that the market is likely to drop an equal distance from the neckline down. In the case of the Standard & Poor's 500, the minimum target price is 1553 965 = 588. This puts the minimum low at 965 588 = 377. (Interestingly, this is close to an estimated low of 314 calculated by Tim Wood in his July article.)
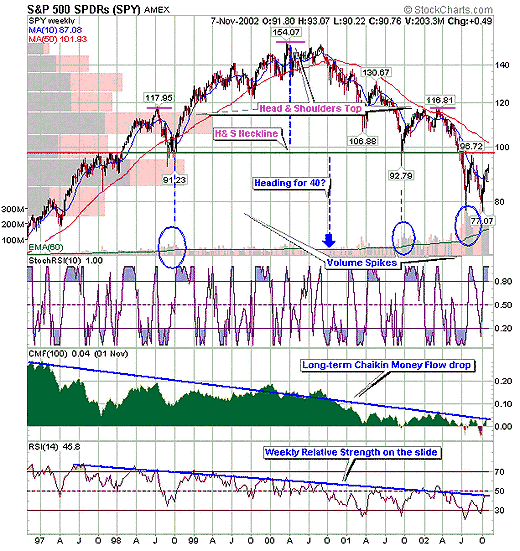
Figure 2: Weekly chart of the S&P depository receipts (SPY) index, 19972002.
Adding fuel to the fire, in Figure 2 the SPY (Standard & Poor's depository receipts) confirms both the head and shoulders pattern and the target of less than half of the current prices. Applying the same principle, the result is a projected minimum SPY target price of $40 (it traded recently around $90). The SPY is used by a number of market technicians to measure global markets, making it an excellent overall market gauge. This suggests that global markets will see values continue to drop substantially unless a new trend is established. As confirmation, both indexes show similar momentum: the Chaikin money flow (CMF) and relative strength index (RSI) indicators drop, which does not bode well for a major change in trend. CMF and the money flow index are excellent confirmation indicators, as they contain a volume component, adding greater credence to any signal. This is not true of stochastics, RSI, or CCI (the commodity channel index). On the topic of volume, it is important to note that in both indexes, volume increased as price rose on the left (bull market) side of the chart, but also increased on price decreases on the right side. One good sign a market is turning around is to measure volume changes with price. If they move in the same direction, it's a bullish sign. If they move in opposite directions, watch out for bears! From a fundamental standpoint, what will it take to support a change in the primary trend? That is beyond the scope of this article, but corporate earnings will have to show continued improvement quarter over quarter, and the US dollar will need to reverse direction. This involves a host of economic conditions, such as a diminishing current account deficit and reduced government deficits. It will also require an increase in foreign direct investment from present anemic levels.
CONCLUSIONThe question of whether the current rally is truly a market bottom or just another bear rally will be put to the test in short order, but calling it a bottom at this point is premature. Prices will either break through the current major support levels set by head and shoulder necklines, or they won't. According to Newton's first and second laws, it is far easier for a trend to continue than to change. Based on this concept and the current economic and corporate fundamentals, a sustained rally and return of the bulls in the near term must be considered a long shot. But if it does happen, you will know from the set of higher highs, higher lows, and breakthroughs of the major resistance levels. They say that forewarned is forearmed. And one last thing: don't let the bears catch you in a false breakout. Wait for the new trend to establish itself first. Jumping in too early could put a major dent in your retirement party. No need to feed the bears. They are quite capable of taking care of themselves.
Matt Blackman is a technical analyst and technical software reviewer for www.thechartmaster.com. He can be reached at matt@goldhaven.com. Matt currently resides in Vancouver, BC.
SUGGESTED READINGWood, Tim [2002]. "When Will This Cruel Bear Market Be Over?", Working Money: July.Charts courtesy of StockCharts.com
Current and past articles from Working Money, The Investors' Magazine, can be found at Working-Money.com.
|
Matt Blackman is a full-time technical and financial writer and trader. He produces corporate and financial newsletters, and assists clients in getting published in the mainstream media. He tweets about stocks he is watching at www.twitter.com/RatioTrade Matt has earned the Chartered Market Technician (CMT) designation.
| E-mail address: | indextradermb@gmail.com |
PRINT THIS ARTICLE

Request Information From Our Sponsors
- StockCharts.com, Inc.
- Candle Patterns
- Candlestick Charting Explained
- Intermarket Technical Analysis
- John Murphy on Chart Analysis
- John Murphy's Chart Pattern Recognition
- John Murphy's Market Message
- MurphyExplainsMarketAnalysis-Intermarket Analysis
- MurphyExplainsMarketAnalysis-Visual Analysis
- StockCharts.com
- Technical Analysis of the Financial Markets
- The Visual Investor
- VectorVest, Inc.
- Executive Premier Workshop
- One-Day Options Course
- OptionsPro
- Retirement Income Workshop
- Sure-Fire Trading Systems (VectorVest, Inc.)
- Trading as a Business Workshop
- VectorVest 7 EOD
- VectorVest 7 RealTime/IntraDay
- VectorVest AutoTester
- VectorVest Educational Services
- VectorVest OnLine
- VectorVest Options Analyzer
- VectorVest ProGraphics v6.0
- VectorVest ProTrader 7
- VectorVest RealTime Derby Tool
- VectorVest Simulator
- VectorVest Variator
- VectorVest Watchdog