HOT TOPICS LIST
- Strategies
- Stocks
- Buy
- Investing
- Brokers
- Psychology
- Interviews
- Accumulate
- Sell
- Hold
- Spotlight
- Websites
- Candlestick Corner
- Gold & Metals
- Options Trading
LIST OF TOPICS
THE CHARTIST
Multiple Indicators II
04/15/03 03:55:54 PM PSTby Dennis D. Peterson
Using more than one indicator at a time will give you better results than just using one alone.
| Indicators have strengths and weaknesses. They often give false signals for buying and selling. To reduce the false signals, technicians nearly always use sets of indicators.
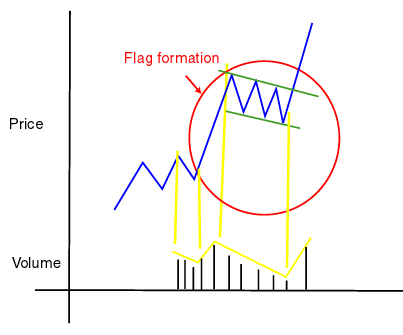
PRICE PATTERNSYou might say that can't be a true statement because those traders using price patterns are only looking at price. However, in almost every case they confirm a price pattern with a volume pattern. With few exceptions, price patterns have appropriate volume patterns. (One exception, you might argue, would be bullish or bearish wedges — although I still look for confirming volume action.) For example, a bullish flag (Figure 1) would have price rising on increasing volume coming into the flag formation, and then volume should decrease while in the flag formation. The anticipated breakout to the upside is accomplished with high volume.
Figure 1: Bullish flag price and volume patterns. Flag patterns, as well as head & shoulders, double tops and bottoms, ascending and descending right triangles patterns, and other price patterns all have confirming volume patterns.
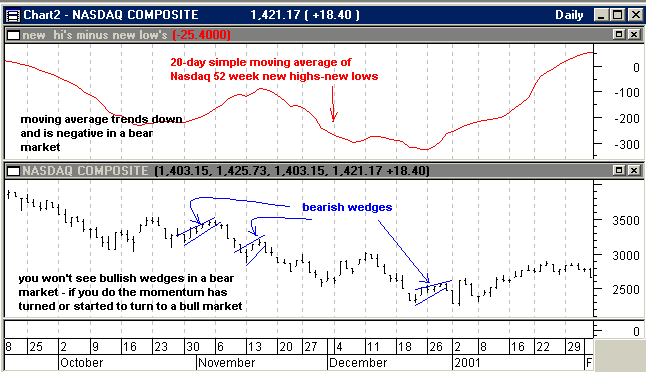
What about the market in general? For example, is the Nasdaq market in a bullish or bearish mindset? A number of indicators can give you an idea, but so does the absence or presence of price patterns. What do I mean by absence? Answer: how many bullish wedges do you see in a bear market? Usually none, if it is a strong bearish market. During the start of the bear move down in the Nasdaq in 2000, a simple moving average of the difference between 52-week new highs and 52-week new lows showed we were becoming bearish because the moving average was negative and moving down. The problem was that the moving average started to move back up (Figure 2: end of October through mid-November), and this might indicate a bullish move. But since there were bearish wedge patterns during this period and no bullish wedge patterns, you would conclude that the market was still bearish — maybe just a little less bearish. In this way, price patterns enhanced your reading of the indicator.
Figure 2: Nasdaq Composite daily price and Nasdaq new highsnew lows (top chart). Once you see the number of 52-week new lows exceed the new highs, it is generally a sign that the market is getting into a bearish mindset. You can confirm this bearish conjecture by looking for short-term patterns such as wedges or flags. Finding no bullish patterns, but only bearish ones, means the market is in a bearish mindset. How far the market will go down is a different problem.
Another interesting feature of wedges is that both the price range narrows and volume decreases as you approach the end of the wedge. Traders use "NR4" (narrow price range, fourth day) as an event to signal something is about to happen. If you examine the wedges in Figure 2, you will see days where the range is the narrowest that it has been in four days. If you use Bollinger Bands on volume, you will see that volume squeezes (contracts in volume volatility) at turning points. Wedges, therefore, are just manifestations of NR4 and volume contraction thrown into a pattern. Recognizing wedges and then using NR4 or Bollinger Band price squeezes doesn't add anything to what is already there. Combining price patterns with market breadth data is a strategy for using independent sets of data. Using both, you have a clearer, more reliable idea of overall market mood or mindset. Let's look at another example of combining visual tools with an indicator. While this is another market breadth example, the principles are easily extended to any equities with strong volume (more than one million shares traded daily).
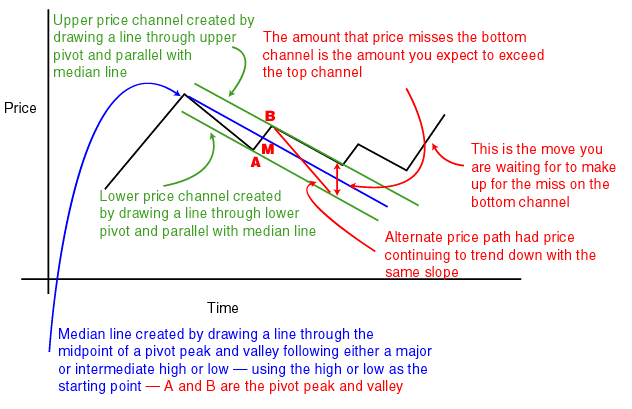
PITCHFORKS AND TURNING POINTSAs price trends up and down, it goes through reactions and rallies. Pitchforks are a useful way to view this price action. Many analysts draw price channels along the price peaks and valleys to get a signal for when price might be breaking out. Pitchforks go one step further because they also have a median line. The upper and lower price channels are drawn through the pivot peak and valley, defining the midpoint (Figure 3).
Figure 3: Price movement analysis using a pitchfork. Price channels are drawn through the first pivot peak (B) and valley (A) following a major or intermediate high (or low) to define a price channel. The upper and lower price channel is drawn parallel to the median line (blue) through the midpoint (M) between the pivot peak (B) and valley (A). If price continues its current trend down, it follows the price action shown with the red line extension, but if it lessens its trend down, it follows the action shown by the black line. The general rule is that, when price fails to touch a price channel line, the miss will be equaled on the other side because price has a new trend direction. The question becomes, when will it happen?
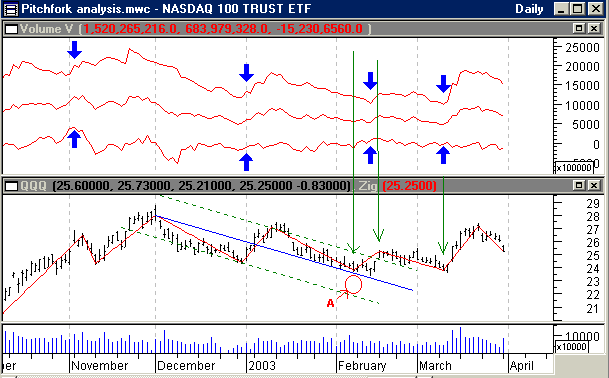
The median gives you a reference to see how well price is behaving in the channel. When price fails to touch a channel, it will generally exceed the other channel by a nearly equal and opposite amount (Figure 3). To see how this happens in real life, look at the recent action in daily QQQ prices. What you see is price turning back up in the beginning of February before reaching the bottom of the price channel (Figure 4: point A). Comparing what price actually did to what might have happened (Figure 3: red line) tells you that the downtrend has lessened. The price swing down from January 10 through February 7 is only slightly smaller than the previous one, but it terminated too soon to reach the bottom of the channel. So why didn't the next upswing in the first week of February push through the upper channel more dramatically — to equal what it missed on the downside?
Figure 4: Daily QQQ price and volume with volume volatility (top chart). Volume volatility is shown as a 12-day simple moving average of Nasdaq up-volume. Upper and lower bands are created by calculating the standard deviation over the last 12 days of Nasdaq up-volume, adding two standard deviations to the moving average for the upper band, and subtracting two standard deviations from the moving average for the lower band. Several times (blue arrows), the volatility decreases or squeezes. Price fails to reach the bottom of the price channel at point A. When will the market make a move to compensate? It appears that the downtrend now has a slightly less negative slope. It is at the pivot valley in March that volatility squeezes, giving a strong indication that the market is about to make a change.
VOLUME VOLATILITY WITH PITCHFORKSThe answer: the market was not positioned to do so — not only in terms of being oversold, but also lessened volatility. It is when volatility quiets down that the market is getting ready to make a move. I used Nasdaq market breadth data to analyze QQQ because it's a proxy for the Nasdaq market. I have created an indicator called volume volatility. It is much like Bollinger Bands in concept. Volume volatility is the 12-day simple moving average of Nasdaq up volume, with an upper band (created by adding two standard deviations of up volume to the moving average) and a lower band (subtracting two standard deviations from the moving average). The standard deviations are calculated using the last 12 days of price change. You can see (Figure 4: blue arrows) that volume volatility has squeezes similar to those of Bollinger Band squeezes. At the pivot valley when price missed the bottom channel (Figure 4: point A), there is no squeeze in volume volatility. You are still waiting for a confirmation signal to see when the market might make a move up beyond the top channel. There is a squeeze on March 12, and this is the one you are waiting for. Here's the issue: when price first starts to create a pivot, you must wait long enough to confirm the turn (pivot). If the turn, in this case an upswing, is short, you won't have enough time to catch it. Thus, you want to wait until you are set up for a turn that will likely exceed the price envelope, giving you enough time to make a profit before the market turns against you. This analysis combines an expected outcome (via price and pivots using a pitchfork) with a timing indicator (volatility) — using price in one case and then independently using volume.
SUMMARYQQQ, as most traders will tell you, is very difficult to trade. But you can certainly improve your risks using multiple indicators. Since QQQ is a proxy for the Nasdaq, you improve your risk/reward ratio by choosing stocks that move with the Nasdaq. Now you have a proxy that gives overall market guidance along with the behavior of an individual stock. With individual stocks, you can ask yourself another set of questions to further enhance your choices. So you can take multiple indicators and get market view, and then use that view in turn to enhance individual stock trading.
Dennis Peterson may be reached at DPeterson@Traders.com.
SUGGESTED READINGPeterson, Dennis D. [2002]. "Trading Systems Using Multiple Indicators," Working Money: November.Charts courtesy of MetaStock (Equis International), eSignal (data)
Current and past articles from Working Money, The Investors' Magazine, can be found at Working-Money.com.
|
Market index trading on a daily basis.
| Title: | Staff Writer |
| Company: | Technical Analysis, Inc. |
| Address: | 4757 California Ave SW |
| Seattle, WA 98116-4499 | |
| Phone # for sales: | 206 938 0570 |
| Fax: | 206 938 1307 |
| Website: | working-money.com |
| E-mail address: | dpeterson@traders.com |
Traders' Resource Links | |
| Charting the Stock Market: The Wyckoff Method -- Books | |
| Working-Money.com -- Online Trading Services | |
| Traders.com Advantage -- Online Trading Services | |
| Technical Analysis of Stocks & Commodities -- Publications and Newsletters | |
| Working Money, at Working-Money.com -- Publications and Newsletters | |
| Traders.com Advantage -- Publications and Newsletters | |
| Professional Traders Starter Kit -- Software | |
PRINT THIS ARTICLE

Request Information From Our Sponsors
- StockCharts.com, Inc.
- Candle Patterns
- Candlestick Charting Explained
- Intermarket Technical Analysis
- John Murphy on Chart Analysis
- John Murphy's Chart Pattern Recognition
- John Murphy's Market Message
- MurphyExplainsMarketAnalysis-Intermarket Analysis
- MurphyExplainsMarketAnalysis-Visual Analysis
- StockCharts.com
- Technical Analysis of the Financial Markets
- The Visual Investor
- VectorVest, Inc.
- Executive Premier Workshop
- One-Day Options Course
- OptionsPro
- Retirement Income Workshop
- Sure-Fire Trading Systems (VectorVest, Inc.)
- Trading as a Business Workshop
- VectorVest 7 EOD
- VectorVest 7 RealTime/IntraDay
- VectorVest AutoTester
- VectorVest Educational Services
- VectorVest OnLine
- VectorVest Options Analyzer
- VectorVest ProGraphics v6.0
- VectorVest ProTrader 7
- VectorVest RealTime Derby Tool
- VectorVest Simulator
- VectorVest Variator
- VectorVest Watchdog


