HOT TOPICS LIST
- Strategies
- Stocks
- Buy
- Investing
- Brokers
- Psychology
- Interviews
- Accumulate
- Sell
- Hold
- Spotlight
- Websites
- Candlestick Corner
- Gold & Metals
- Options Trading
LIST OF TOPICS
THE CHARTIST
In Search Of The Trendilator
07/08/03 04:31:27 PM PSTby Matt Blackman
When equities are trending, one group of indicators works best. When prices are stuck in a trading range, other indicators are more successful. Wouldn't it be nice to find one indicator that worked well in both types of markets?
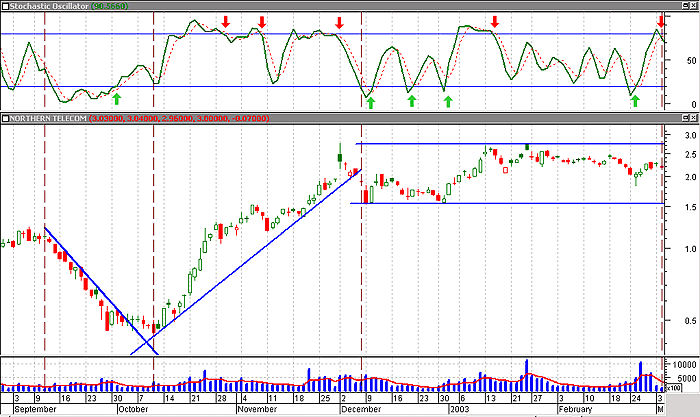
| At the risk of oversimplification, there are two types of markets, at least from the technician's point of view. The first is a trending market. The trending market moves in stages, setting a series of higher lows and higher highs in an uptrend and lower highs and lower lows in a downtrend. Trades are placed on retracements, and only made in the direction of the trend so that in the event a trade loses in the short-term, time will work in the trader's favor (assuming the trend does not reverse in the meantime). The second market type is an oscillating or trading-range market, and it's only for short-term traders. Because there is no underlying trend, the risk is higher. Both types of markets are discussed in detail in my Working Money article, "Most Of What You Need To Know About Technical Analysis. . .". Technical analysis provides specific indicators that work best in each market. In trending markets, these include moving averages and trendline breaks. An oscillating market is best traded using oscillators or momentum indicators. It is relatively obvious to all but the newest traders that trying to use trendlines or moving averages to trade an oscillating market is not a good idea. Too many whipsaws take place. But the reasons for not using an oscillator as a primary indicator in a trending market are not as obvious. At first glance, it appears that an oscillator should work well in a trending market, but when you consider momentum oscillator mechanics, you may spot the problem. Once in a strong uptrend, oscillators such as the relative strength index (RSI), commodity channel index (CCI), ultimate oscillator, money flow index (MFI), or stochastic remain stuck in the upper part of the indicator chart, rarely generating a buy signal until the trend has weakened. Sell signals are given as the equity fluctuates back and forth in the trend, but the signal line seldom retraces far enough to generate a buy signal. The reverse holds true in a strong downtrend. Oscillators provide buy signals, but few sells until the trend breaks down. Any trader who employs only standard oscillators in trends (only buying in downtrends and selling short in uptrends) or moving average crossovers in range-bound markets would soon lose all his money! (See Figure 1.)
Figure 1: Daily chart of Nortel Networks (NT), showing a downtrend in September-October 2002, an uptrend in October-December, and an oscillating market in December-March 2003. The stochastic oscillator (5,3,3) in the upper window generates only buy signals (green arrows) in a downtrend, and only sell signals (red arrows) in an uptrend. The indicator worked far better in an oscillating market.
If the same trader had waited for the oscillator signal to be confirmed by a change in trend, he would have been rewarded handsomely in the example of Figure 1. A stochastic buy signal was generated on October 1, two days before the downtrend line was broken at $0.50. The resistance level sat at $0.53. Nortel Networks hit a low of $0.44 before recovering and decisively breaking the resistance level on October 14, suggesting the start of a tentative uptrend. A trendline is confirmed only when it has been touched and holds at least three times. By October 17, the new uptrend line had been touched four times as NT moved up, thereby confirming the signal in the direction of the desired move, and a trade would have been entered. But the trader must understand what type of market he is in before choosing the primary indicator. I decided to construct a test that would help me combine a trend and an oscillator indicator into one (the "trendilator"). First, I would test a 21-period relative strength index (RSI) using 30-70 crossovers to generate buy and sell signals on a group of 50 relatively volatile stocks (trading on US and Canadian exchanges). I would also test a hybrid between the stochastic oscillator and the RSI — called the stochasticRSI — using 10-periods with 20-80 crossovers triggering buys/sells. When I compared the results, I found that the RSI generates too few signals and the stochastic oscillator too many. StochasticRSI signals tend to be more reliable. I decided to compare these results to those obtained by employing optimization and a moving average of a different period signal line to replace the static 30-70 and 20-80 lines for both the RSI and stochasticRSI indicators. This would tell me whether the trading results improved significantly. Theoretically, an optimized moving average signal line should help determine the cycles of each security tested, and work in both trending and trading markets. I generated all tests using the MetaStock end-of-day version 8.0 System Tester. I conducted the tests using 250 periods (days). Trades were entered at the open the day after signals were generated. Commissions were set at $14.95 per trade, 100% of the equity was invested in each trade, and margin was set at 150%.
RSI 70/30 CROSSOVER (21 PERIODS)Here are the MetaStock formulas for the first test:
Enter Long / Close Short Cross(RSI(21), 30) Enter Short / Close Long Cross(70, RSI(21))
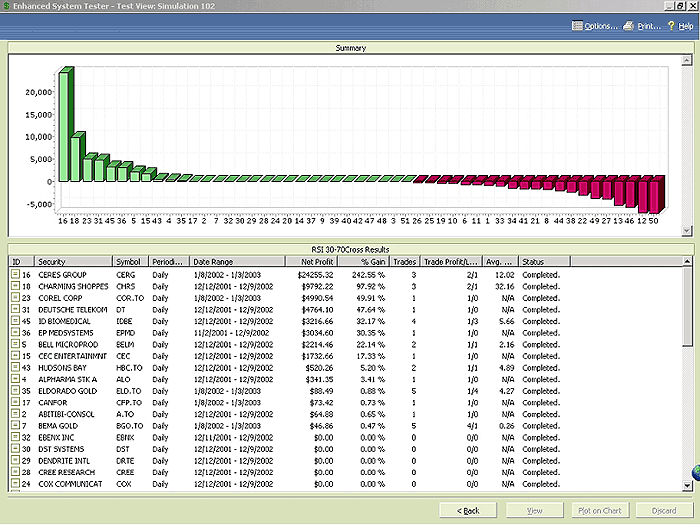
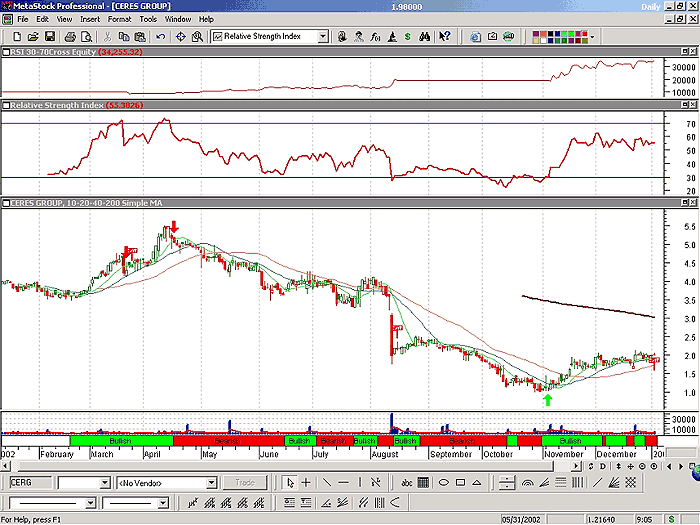
A buy signal is generated when the RSI line moves up across the 30 line, and a sell when it moves down across the 70 line (see Figures 2 and 3).
Figure 2: Results of RSI 70/30 crossover test, showing the top 19 results for 250 periods between January 2002 and January 2003. The high scorer was Ceres Group (CERG), with a return of 242% in three trades. Only 14 of 50 securities had positive returns.
Figure 3: Daily chart of Ceres Group (CERG), winner of the RSI 70/30 crossover test, showing buy and sell signals, relative strength index (middle window) and equity line (top window).
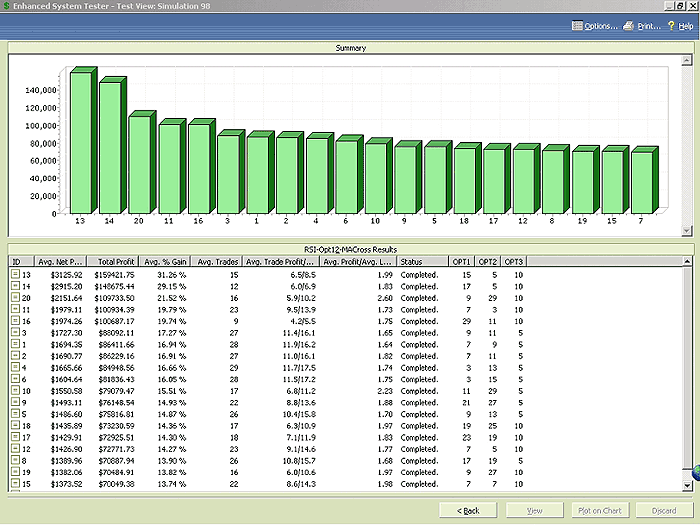
RSI-MOVING AVERAGE CROSSOVER WITH THREE OPTIMIZATIONSNext, I conducted tests on the same group of 50 stocks, but this time, using optimized periods. Periods for the RSI indicator line (Opt1) ranged from a low of 3 to a high of 50 in steps of 2. Next, I set the moving average of a second RSI indicator with optimization (Opt2) ranging from 3 to 60 in steps of 2. I took the moving average of this line with a third optimization period (Opt3) of 5 to 20 in steps of 5. When using three optimizations, you must be careful to keep the potential variables to a minimum, or the tests can take a very long time (especially on older computers). Here are the formulas for MetaStock (see Figures 4, 5, and 6 for results):
Enter Long / Close Short Cross(RSI(Opt1), Mov(RSI(Opt2),Opt3,S)) Enter Short / Close Long Cross(Mov(RSI(Opt2),Opt3,S), RSI(Opt1))
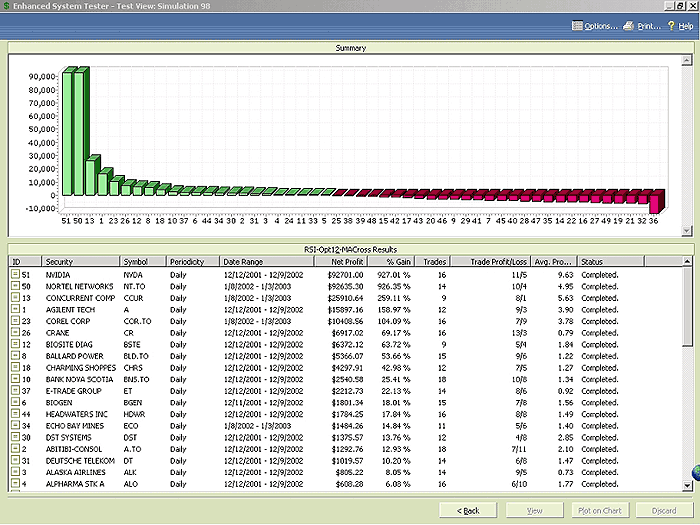
Figure 4: Results of RSI with three optimizations on 50 stocks. The top optimization period was 15, 5, and 10, with an average annual group return of 31.26%. (See the list of top-scoring stocks in Figure 5.)
Figure 5: List of top winners of the RSI-MA cross, with optimization in the top Opt category (15, 5, 10 periods). Nvidia (NVDA) and Nortel Networks (NT.TO) are in the lead. All 19 stocks in this test had positive returns.
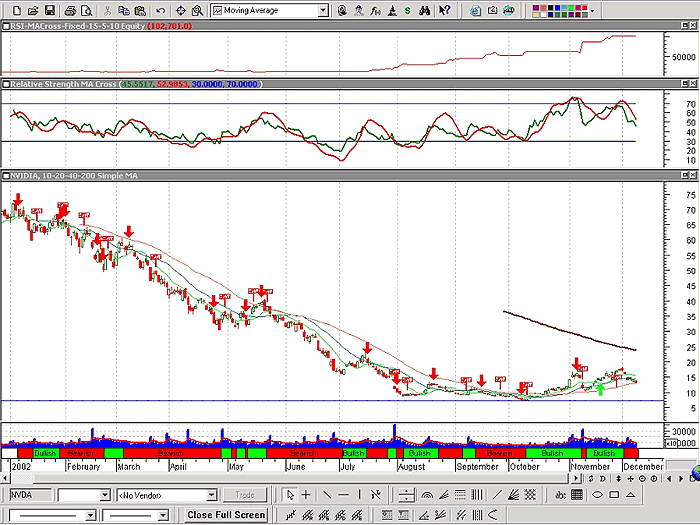
Figure 6: Daily chart of Nvidia (NVDA) with RSI-MA cross using three optimization periods. The chart shows buy (green arrows) and sell (red arrows) signals, the RSI indicator and RSI-MA signal line (middle window), and the equity curve (top window).
STOCHASTICRSI 80/20 CROSS (10 PERIODS)The MetaStock formulas for this system test are (see Figure 7):
Enter Long / Close Short Cross((Sum(RSI(10)-LLV(RSI(10),10),3)/Sum(HHV(RSI(10),10)-LLV(RSI(10),10),3))*100, 20)
Enter Short / Close Long Cross(80, (Sum(RSI(10)-LLV(RSI(10),10),3)/Sum(HHV(RSI(10),10)-LLV(RSI(10),10),3))*100)
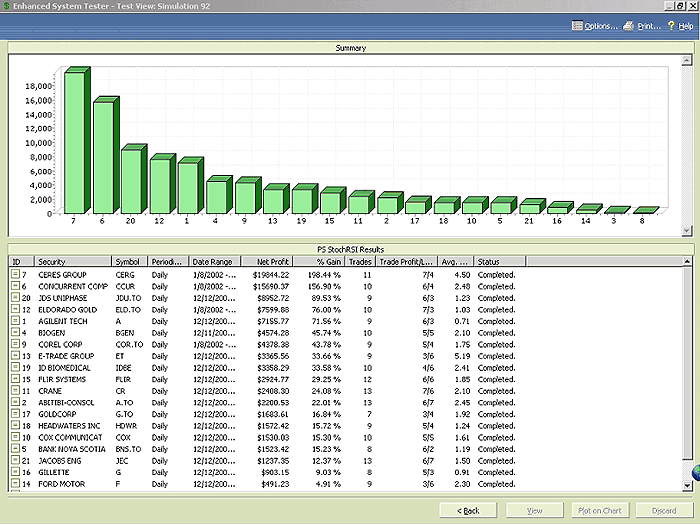
Figure 7: Results for the stochasticRSI 80/20 cross were better than the RSI 70/30 cross, but not as good as the RSIMA cross with three optimizations. Twenty-one stocks had positive returns.
STOCHASTICRSI MOVING AVERAGE CROSSOVER WITH THREE OPTIMIZATIONSFinally, I conducted a test using the stochasticRSI-MA cross with three optimizations. I have found the stochasticRSI to be one of the more reliable momentum indicators. In theory, using a moving average and optimization should make it more effective and take into account the cyclic nature of the equities being tested. Here are the MetaStock formulas for the test:
Enter Long / Close Short StochRSI:=Sum(RSI(opt1)-LLV(RSI(opt1),opt1),3)/Sum(HHV(RSI(opt1),opt1)-LLV(RSI(opt1),opt1),3)*100; MASRSI:=Mov(Sum(RSI(opt2)-LLV(RSI(opt2),opt2),3)/Sum(HHV(RSI(opt2),opt2) -LLV(RSI(opt2),opt2),3)*100,opt3,S); Cross(StochRSI, MASRSI)
Enter Short / Close Long StochRSI:=Sum(RSI(opt1)-LLV(RSI(opt1),opt1),3)/Sum(HHV(RSI(opt1),opt1)-LLV(RSI(opt1),opt1),3)*100; MASRSI:=Mov(Sum(RSI(opt2)-LLV(RSI(opt2),opt2),3)/Sum(HHV(RSI(opt2),opt2) -LLV(RSI(opt2),opt2),3)*100,opt3,S);
Cross(MASRSI, StochRSI)
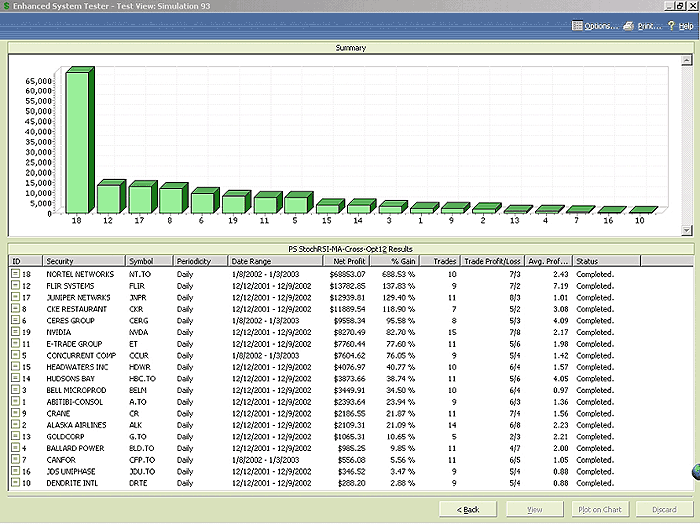
The periods for the stochasticRSI indicator line (Opt1) ranged from a low of 3 to a high of 50 in steps of 2. Next, the moving average of a second stochasticRSI with optimization (Opt2) were set, ranging from 3 to 60 in steps of 2. The moving average of this line was taken with a third optimization period (Opt3) of 5 to 20 in steps of 5. See Figures 8 and 9 for results.
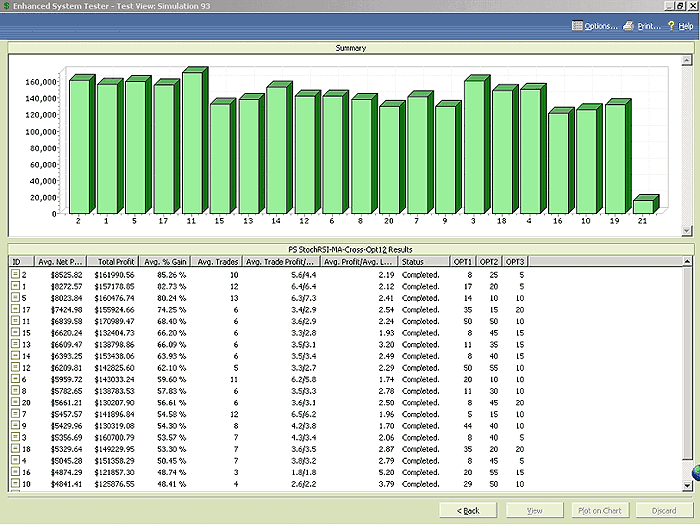
Figure 8: Results from the StochRSI-MA cross with three optimizations are grouped according to the optimization periods. The highest-scoring group was for the periods of 8, 25, and 5 days. However, the top 19 groups all had respectable results.
Figure 9: Top 19 stocks for the highest-scoring optimization periods of 8, 25, and 5 days.
EYEBALLING TRADING CANDIDATESThe Indicator Builder function in MetaStock can be used to eyeball optimal time periods on your favorite securities. Here is the Indicator Builder formula I use for the RSI and stochasticRSI to check various time periods for better fits. They can be changed quickly when looking at individual stocks by assigning variables to the three periods (see Figure 10).
RSI with MA and three periods x:=Input("RSI1Periods", 2, 30, 5); y:=Input("RSI2Periods", 2, 50, 9); z:=Input("MAPeriods", 1, 50, 10);
RSI(X); Mov(RSI(Y), Z, S);
30; 70
StochasticRSI with MA and three periods X:=Input("SRSI1Periods",2,50,9); Y:=Input("SRSI2Periods", 3, 60, 9); Z:=Input("MAPeriods", 1, 50, 5);
(Sum(RSI(X)-LLV(RSI(X), X), 3)/Sum(HHV(RSI(X), X)-LLV(RSI(X), X), 3))*100;
Mov((Sum(RSI(Y)-LLV(RSI(Y), Y), 3)/Sum(HHV(RSI(Y), Y)-LLV(RSI(Y), Y), 3))*100, Z, S);
20; 80
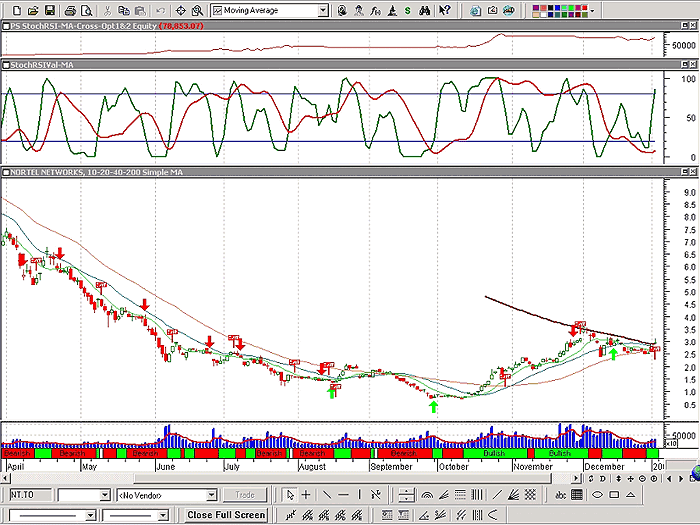
Figure 10: Daily chart of Nortel Networks (NT.TO), winner of the optimized stochasticRSIMA crossovers system test. The chart shows buy/sell signals (green and red arrows), stochasticRSI signals and MA lines (middle window), and the equity curve (top). The test only allowed short trades in downtrends and long trades in uptrends when the system tester was set to permit just one simultaneous trade.
CONCLUSIONSThere are a few caveats about using a backtester to find trading candidates. No matter how good a backtest program is, it is not real life, so results should be taken with grain of salt. At the time of the tests, I was using both MetaStock 8.0 and 7.2 on two computers. For some reason, results from the System Tester using the same periods, equities, and parameters often varied substantially between the two systems. In many cases one exceptional trade can skew results so much that they cannot be replicated in other time periods. For example, I retested Nortel Networks (NT.TO) for 250 days prior to May 16, 2003, but this time, I used MetaStock Professional Version 8.01. Nortel still scored well, with an annual return of 442%, but the best optimization periods of 35, 30, and 10 were quite different from the top-scoring periods in the original test of 8, 25 and 5. To make matters worse, the return for the latter periods was an unimpressive 22%. The moral here is that no matter how impressive the results of any backtest, they should be retested over a number of different time frames. Only when a level of consistency appears should you move to the next level of testing. Finally, you should also do some paper trading in real time. The good news is that thanks to the speed of newer computers and the ability to backtest multiple securities using two or even three optimization periods in the latest version of MetaStock, it does not take long to locate some very intriguing trading candidates. It is also important to point out that stocks each have their own personality, which is why it is crucial test them independently. For example, taking the results of a test on Nortel and expecting similar results with the same parameters for Microsoft is a mistake. This is why many traders become intimately familiar with a group of stocks, taking the time to get to know how each reacts to fundamental information such as news and to various market conditions. In a nutshell, here are the conclusions that can be derived from the tests I have just described.
Matt Blackman is a trader, technical analyst, software reviewer, and content provider for technical trading/investment websites. He is an affiliate member of the Market Technicians Association (MTA) and Canadian Society of Technical Analysts (CSTA), and is currently enrolled in the Chartered Market Technicians (CMT) program.
SUGGESTED READINGBlackman, Matt [2003]. "Most Of What You Need To Know About Technical Analysis," Working Money: February 4.
Charts courtesy of MetaStock (Equis International).
Current and past articles from Working Money, The Investors' Magazine, can be found at Working-Money.com.
|
Matt Blackman is a full-time technical and financial writer and trader. He produces corporate and financial newsletters, and assists clients in getting published in the mainstream media. He tweets about stocks he is watching at www.twitter.com/RatioTrade Matt has earned the Chartered Market Technician (CMT) designation.
| E-mail address: | indextradermb@gmail.com |
PRINT THIS ARTICLE

Request Information From Our Sponsors
- VectorVest, Inc.
- Executive Premier Workshop
- One-Day Options Course
- OptionsPro
- Retirement Income Workshop
- Sure-Fire Trading Systems (VectorVest, Inc.)
- Trading as a Business Workshop
- VectorVest 7 EOD
- VectorVest 7 RealTime/IntraDay
- VectorVest AutoTester
- VectorVest Educational Services
- VectorVest OnLine
- VectorVest Options Analyzer
- VectorVest ProGraphics v6.0
- VectorVest ProTrader 7
- VectorVest RealTime Derby Tool
- VectorVest Simulator
- VectorVest Variator
- VectorVest Watchdog
- StockCharts.com, Inc.
- Candle Patterns
- Candlestick Charting Explained
- Intermarket Technical Analysis
- John Murphy on Chart Analysis
- John Murphy's Chart Pattern Recognition
- John Murphy's Market Message
- MurphyExplainsMarketAnalysis-Intermarket Analysis
- MurphyExplainsMarketAnalysis-Visual Analysis
- StockCharts.com
- Technical Analysis of the Financial Markets
- The Visual Investor

