HOT TOPICS LIST
- Strategies
- Stocks
- Buy
- Investing
- Brokers
- Psychology
- Interviews
- Accumulate
- Sell
- Hold
- Spotlight
- Websites
- Candlestick Corner
- Gold & Metals
- Options Trading
LIST OF TOPICS
THE CHARTIST
A Generational Top
07/17/03 10:06:49 AM PSTby Eric Morgan
It's possible that the Dow Jones Industrial Average set a top in 2000 that won't be broken anytime soon.
| The bull market top in the DJIA in January of 2000 may stand as a top that won't be exceeded for a generation or more. Rather than guessing about the future like the public and pundits do, I would like to apply some mathematics and some reason to the process of divining the future. I'll do this using price and time analysis. My tools for this exercise are the Fibonacci series and Elliot wave theory, which were discussed in my previous Working Money article, "Forecasting With Elliott Wave Theory."
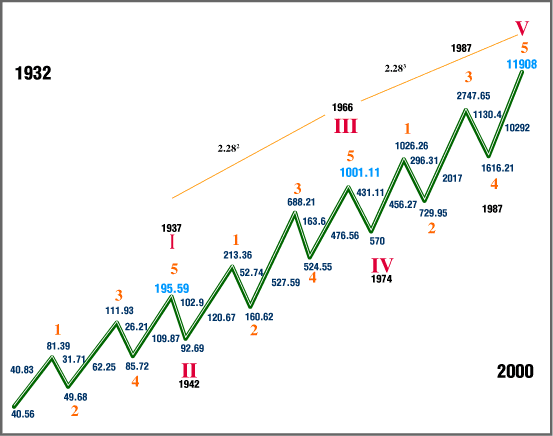
ANALYZING IT The Fibonacci series was discovered by Italian mathematician Leonardo de Pisa in the 13th century. The sequence is 1, 1, 2, 3, 5, 8, 13, 21, 34, 55, 89, and so on; the sum of any two adjacent numbers equals the next number. After the first few numbers, the relationship between two adjacent numbers is the value 1.618, or its inverse, 0.618. This number is called the Fibonacci ratio. The ratio describes the growth rate of many natural systems, like rabbit populations, sunflower seed development, seashell development, and so on. Let's start the analysis with a look at time (Figure 1). This Elliott wave supercycle structure extended over a 68-year time frame, dividing into two perfect 34-year sections. The first 34-year time interval encompassed cycles I, II, and III. It ended with the cycle III top in 1966. The second 34-year time interval encompassed cycles IV and V, and ended in January 2000. The number 34 is a Fibonacci value, and Fibonacci numbers are significant in Elliott wave theory.
Figure 1: The supercycle structure from 1932 to 2000. There are two identical Fibonacci sections, the first from 1932 to 1966, and the second from 1966 to 2000.
Notice how a Fibonacci time interval plays into the length of each wave (Robert Prechter first detailed these relationships years ago). It took five years to complete cycle I (1932-1937). It took five years to complete cycle II (1937-1942). It took 24 years to complete cycle III, which was not a Fibonacci time interval, but cycle IV was, since it lasted for eight years (1966-1974). Cycle V was 26 years in duration, which divides into two 13-year Fibonacci time intervals. Notice that primary waves 1, 2, and 3 encompassed the first 13-year interval (1974-1987), and primary waves 4 and 5 encompassed the second Fibonacci 13-year interval. This is what occurred in the two 34-year sections where cycles I, II, and III were encompassed by the first 34-year time interval, and cycle IV and V were encompassed by the second 34-year time interval. A smaller pattern replicated the larger pattern. As the smaller pattern completed, so did the larger pattern. This is commonly observed in fractal analysis. Any Elliott wave analyst who wasn't asleep would have known that the year 2000 represented a major turning point for the DJIA: A 68-year advance terminated in January 2000. (It will take more than a three-year downtrend to correct that kind of advance!) Timewise, everything pointed to a major trend reversal for the DJIA in the year 2000.
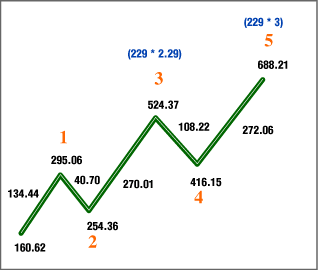
WHY A TOP? Now let's analyze, in terms of price, why the supercycle advance in the DJIA terminated in January 2000. To do this, we simply have to analyze the most important tops in the supercycle advance and see how they relate to each other. The most important tops in the supercycle were, of course, the cycle I, III, and V tops. Referring to Figure 1, the tops were 195.59, 1001.11, and 11908, respectively (all DJIA numbers used are theoretical highs, not actual intraday print numbers). First divide the cycle III top by the cycle I top. The result is 5.11 (1001.11 / 195.59). Now divide the cycle V top by the cycle III top. The result is 11.89 (11908 / 1001.11); 11.89 = 2.283, and 5.11 = 2.262, but if the cycle I top was just three points less (192.59 instead of 195.59), then the relationship between the cycle III top and the cycle I top would be exactly 2.282. So the cycle I, III, and V tops relate to each other through the ratio 2.28, where cycle III / cycle I = 2.282, and cycle V / cycle III = 2.283. Isn't that remarkable? That's why the bull market turned tail at 11908 on January 14, 2000. The cycle V top fulfilled its relationship with the tops of cycles I and III. But there's more. Let's examine how almost all of the primary wave 3 and 5 tops of cycles I, III, and V are related to the number 229, starting with the cycle I top. The log of the primary wave 5 top of cycle I is 2.29 (log 195.59). The primary wave 3 top of cycle III is 688.21; 688.21 / 229 = 3.00. The primary wave 5 top of cycle III is 1001.11; 1001.11 / 229 = 4.37. The primary wave 3 top of cycle V is 2746.65; 2746.65 / 229 = 12.00. The primary wave 5 top of cycle V is 11908; 11908 / 229 = 52. The supercycle advance terminated exactly when it reached 52 * 229. What's so special about 52? Well, there are 52 weeks in the year, and the 52nd week represents the end of the year, so 52 might represent the end of the bull as well. Perhaps 52 is reflected in the net distance between the start of cycle I and the cycle II low (92.69 - 40.56 = 52.13). The number 52 is 40.56 * 1.282, where 40.56 is the beginning of the supercycle, and 1.288 is the relationship between the length of the first two waves in the supercycle structure (40.83 / 31.71 = 1.288). Perhaps it's because 52 = 228 * 0.228. Whatever the case, the end of the advance occurred when the DJIA reached the magic number 229 * 52. The only major top in the supercycle advance that didn't relate to the number 229, once 229 was exceeded, was the cycle III top at 1001.11. It didn't divide evenly by 229. Why? The answer is in Figure 2. This is the primary wave 3 advance of cycle III, subdivided into its five-wave structure of intermediate degree. The intermediate wave 3 top was 524.37; 524.37 / 229 = 2.29. The intermediate wave 5 top was 688.21; 688.21 / 229 = 3. Now, note that the log of the cycle I top is 2.29 (log 195.59), and the log of the cycle III top is 3.00 (log 1001.11).
Figure 2: Primary wave 3 advance of cycle III.
WHAT DO WE HAVE HERE? The intermediate wave 3 top relates in a linear fashion to the intermediate wave 5 top by the ratio 2.29 to 3 through the number 229, just as the cycle I top relates logarithmically to the cycle III top by the ratio 2.29 to 3. What appeared as a linear relationship at the intermediate degree between tops expressed itself as a logarithmic relationship at two cycle-degree tops. That's why the cycle III top didn't divide evenly by 229. It had the more important function of maintaining a relationship with the cycle I top. This is an example where a fractal pattern at one level expressed itself again at a higher level, except on a different scale. This is an elegant, real-world mathematical structure. The mathematics are undeniable, and they provide cogent evidence that the market is not random. The DJIA is tracing out a mathematical design. Some of the mathematics have been revealed here, but there is always more to discover.
IN SUMMARY The 68-year uptrend terminated because both time and price ran out. The price level was fulfilled with respect to the number 229 and the ratio between cycle tops of 2.28 and its powers of 2 and 3. Time ran out because the Fibonacci 13-year and 34-year time intervals were completed in the year 2000. This is a strong argument why the January 14, 2000, top of the DJIA will stand for perhaps decades to come, just as the market top of 1929 stood for so long. When will the supercycle bottom occur? It's highly probable that the bottom will occur in a Fibonacci time span dating from the January 2000 top. The candidates are 5, 8, 13, 21, or 34 years from that date. The price level will be at equivalently devastated levels, on a par with the market action of 1929-1932.
Eric Morgan is an electronics engineer and can be reached at morganed@nswc.navy.mil.
SUGGESTED READING Frost, A.J., and Robert Prechter [1985]. Elliott Wave Principle, New Classics Library. Morgan, Eric [2003]. "Forecasting With Elliott Wave Theory," Working Money: May 13.
Yahoo! Finance
Current and past articles from Working Money, The Investors' Magazine, can be found at Working-Money.com.
|
| E-mail address: | morganed@nswc.navy.mil |
PRINT THIS ARTICLE

Request Information From Our Sponsors
- StockCharts.com, Inc.
- Candle Patterns
- Candlestick Charting Explained
- Intermarket Technical Analysis
- John Murphy on Chart Analysis
- John Murphy's Chart Pattern Recognition
- John Murphy's Market Message
- MurphyExplainsMarketAnalysis-Intermarket Analysis
- MurphyExplainsMarketAnalysis-Visual Analysis
- StockCharts.com
- Technical Analysis of the Financial Markets
- The Visual Investor
- VectorVest, Inc.
- Executive Premier Workshop
- One-Day Options Course
- OptionsPro
- Retirement Income Workshop
- Sure-Fire Trading Systems (VectorVest, Inc.)
- Trading as a Business Workshop
- VectorVest 7 EOD
- VectorVest 7 RealTime/IntraDay
- VectorVest AutoTester
- VectorVest Educational Services
- VectorVest OnLine
- VectorVest Options Analyzer
- VectorVest ProGraphics v6.0
- VectorVest ProTrader 7
- VectorVest RealTime Derby Tool
- VectorVest Simulator
- VectorVest Variator
- VectorVest Watchdog


