HOT TOPICS LIST
- Strategies
- Stocks
- Buy
- Investing
- Brokers
- Psychology
- Interviews
- Accumulate
- Sell
- Hold
- Spotlight
- Websites
- Candlestick Corner
- Gold & Metals
- Options Trading
LIST OF TOPICS
MARKET UPDATE
Dollars, Debt, Stocks, And "Things"
07/15/03 04:14:11 PM PSTby David Penn
The conventional wisdom on the markets continues to be turned on its head.
| In a recent market update for Working Money ("The Reflation Trade," June 10, 2003), I noted the strange phenomena of non-correlated asset groups rallying at the same time in the late spring of 2003. This odd party of simultaneous bull markets in stocks, gold, and government bonds, I suggested, was indicative of the reflation campaign that was accelerated by the Federal Reserve under the leadership of Chairman Alan Greenspan (and his consigliere, Fed governor Ben Bernanke) back in the autumn of 2002, when the stock market was plunging into multi-year lows and the financial markets were allegedly in danger of "freezing up." Since that time, both bonds and gold have buckled. The 10-year Treasury bond, for example, appears to have peaked in mid-June, with gold's secondary rally in the spring having peaked out a month earlier. Stocks paused temporarily in late June and have been consolidating going into July. Does the fact that stocks have stalled while the other three members of the party have outright faltered and begun to retreat suggest that the reflation season is over? Perhaps more to the point, does this mean that stocks, which joined both bonds and gold for the spring ride up, will be similarly joining bonds and gold for a summer ride back down? Longer-term charts of stocks (as represented by the Standard & Poor's 500), the 10-year Treasury note, the CRB Index (the leading commodity index), and the US dollar help put some of these questions into clearer context — even if this context makes some of the conventional wisdom with regard to traditional intermarket relationships hard to believe. Further, longer-term charts may help clarify the inflation/deflation debate — at least in terms of what investors and traders need to consider before weighing in on any given side of the debate.
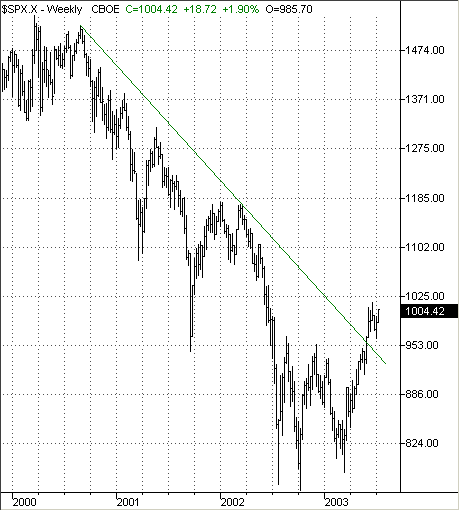
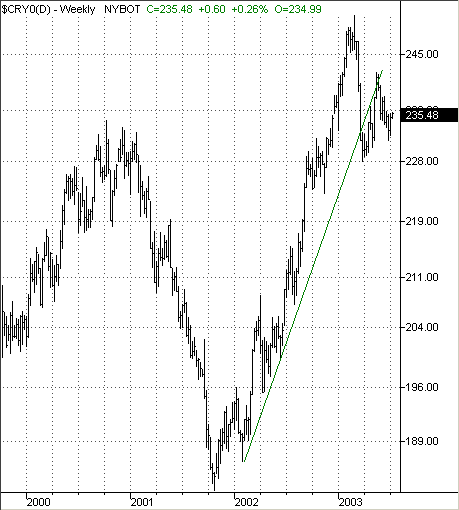
CHARTS STILL DON'T LIEWhat do we see when we look at longer-term price charts of stocks, bonds, commodities, and the US dollar? The three and a half year charts provided here are fairly illuminating. We can see, for example, that stocks have been in a dedicated downtrend since late 2000, as marked by a downward trendline that has only recently been broken to the upside (see Figure 1). The most recent bull market in commodity prices has also broken a trendline — though in this case, the move is shorter than that in stocks (commodities put in a bottom in late 2001) and prices are breaking to the downside.
Figure 1. Stocks break out above a long-term downtrend line in the second quarter of 2003.
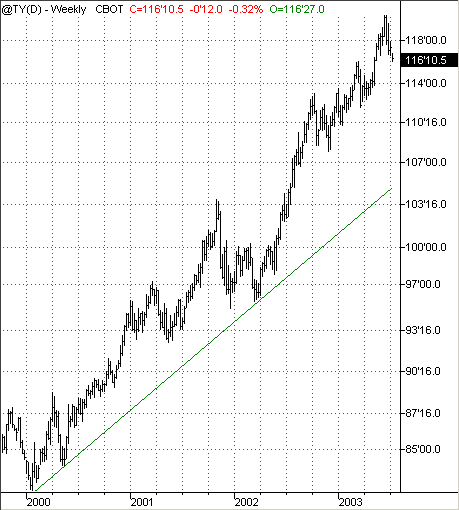
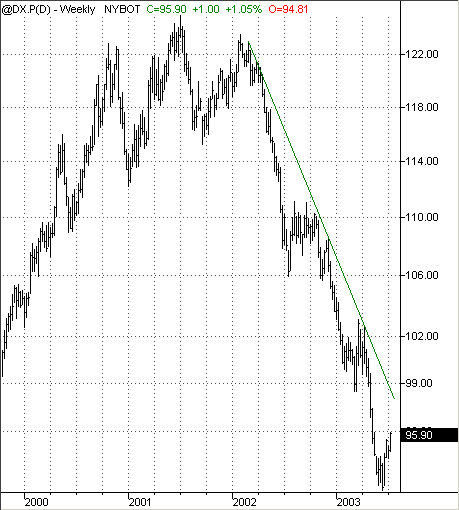
The bonds chart shows a market that, over the past three and a half years, has been as bullish as stocks have been bearish. In fact, where stocks and commodities are crossing major trendlines, we see the price chart of the 10-year T-note showing, if anything, bonds being quite extended from their longer-term uptrend line. As for the US dollar, the greenback made its last peak in early 2002, shortly after commodities bottomed — and has been in a downtrend ever since. And in the same way that bonds have extended themselves away from their trendline to the upside, the US dollar index has extended itself away from its trendline — to the downside. On this basis alone, the two most likely developments are that overvalued bonds (see Figure 2) will pull back toward their uptrend line and that undervalued US dollars will bounce up toward their downtrend line. Conventional wisdom suggests that a bounce in the dollar will be a negative for commodities — and the topping action in the price chart of the CRB seems to support the notion of a rebounding US dollar. But how might a collapsing bond market, one that, perhaps, revisits the lows of 2002 (10-year Treasury prices as low as 97, with yields as high as 5.3%) affect a stock market that is attempting to successfully break through a three-year downtrend line?
Figure 2. The remarkably resilient bull market in government long-term bonds appears increasingly overextended in mid-2003.
THE DEFLATIONARY DIFFERENCEOne of the most important developments in the arena of intermarket technical analysis has been the (re)discovery of "Gibson's paradox," (see my Working Money article from March 26, 2002 on the subject). Gibson's paradox suggests that during deflationary periods characterized by a demand for money in excess of the supply of money or, at root, a currency that is overvalued relative to the things it can buy, the typical relationship in which stock prices follow bond prices is turned upside down. In a deflationary scenario, according to Gibson's paradox, stock prices move conversely to bond prices or, in other words, stock prices follow bond yields. A number of explanations exist as to why this is so. But suffice it to say that the inflation that tends to accompany an economy that is moving out of deflation tends to put upward pressure on bond yields. This same inflation also tends to put upward pressure on corporate earnings (corporations are able to raise prices in the increasingly inflationary environment — even if the inflation would be considered modest in any other economic environment short of deflation). Technical signs of renewed deflation are principally twofold (or two and a halffold). The first would be a rise in the US dollar index, which seems imminently possible, at least in the short term. The second would be a collapse in commodities, particularly gold (the "half" mentioned). While the notion of a rising dollar is hard for many to believe given the fall it has taken since early 2002, the idea of a sizable correction in commodities is not too difficult to imagine, especially with major commodities such as gold and crude oil appearing on the verge of decline here in mid-summer 2003 (see Figure 3). And any significant collapse in the price of gold or in crude oil would be bullish for the dollar in the first instance and bullish for the economy in the second instance — which would, in turn, be on-balance bullish for the dollar.
Figure 3: Growing weakness in gold and crude oil in the summer of 2003 is contributing to lower prices in the CRB Index.
Gibson's paradox was more common during the gold standard era of US financial history. This is largely because a gold-backed currency is much harder to inflate than a currency with a value backed by little more than the government's willingness to back it. Under an economic system in which the currency is backed by gold, deflationary crises — in which all other assets are either sold off in a panicked attempt to raise cash to retire debt, or are liquidated swiftly to avoid a dramatic loss in value — are far more likely than in a government-backed or fiat money system. In fact, a gold-backed currency is more likely to occasionally become overvalued as the business cycle turns down, largely based upon its status as a reliable store of value in difficult economic times.
STOCKS AND BONDS TOGETHER AGAIN?It appears that the cloudiest picture in the intermarket quartet is the picture for stocks, which have been rallying strongly since mid-March 2003. If we follow the (re)inflationary playbook — which is increasingly not suggested by price action in commodities — then stocks may continue upwards against a looming threat of higher interest rates. In this scenario, deflationary risks are eliminated by massive reflation on the part of the Federal Reserve, and intermarket relationships begin to resemble those encountered in a mild inflation/mild disinflation environment (as was the case during most of the 1980s and the first half of the 1990s). This scenario would also necessitate a continued turn in bonds to the downside, as well as a failure in the US dollar index to move up appreciably from current levels (around 94). (See Figure 4.)
Figure 4: A short-term rally in the US dollar index, which is overextended to the downside, seems increasingly likely during the summer of 2003.
However, if we follow the deflationary playbook — which is suggested by price action in the commodities — then stocks might also be expected to continue moving forward. But this scenario would also suggest that any near-term correction in bonds would be relatively mild (top-quality bonds being among the chief beneficiaries in a deflationary environment) and that continued high bond prices and lower and lower bond yields would resume. The question in this scenario is, how long might stocks continue to rally in the face of a rising government bond market? The deflationary playbook, pursuant to Gibson's paradox, suggests that the answer is: not for very long. One scenario that borrows from both of the above possibilities is a continued rally in stocks that takes place concurrently with weakness in bonds. This rally in stocks would last only as long as the correction in bonds, after which — along with a rising dollar and falling commodities — stocks would come under increasingly deflationary pressure and begin to falter. The advantage of this scenario is that it doesn't necessitate fading the spring-summer rally in stocks in order to satisfy the "rules" of deflationary market dynamics. Nor does it ignore the capacity of the Federal Reserve to provide reflationary relief rallies to support asset prices, particularly if those assets are common stocks and private homes.
David Penn may be reached at DPenn@Traders.com.
SUGGESTED READINGPenn, David [2003]. "The Reflation Trade," Working Money: June 10._____ [2002]. "Gibson's Paradox," Working Money: March 26. Charts courtesy of TradeStation (TradeStation Technologies)
Current and past articles from Working Money, The Investors' Magazine, can be found at Working-Money.com.
|
Technical Writer for Technical Analysis of STOCKS & COMMODITIES magazine, Working-Money.com, and Traders.com Advantage.
| Title: | Traders.com Technical Writer |
| Company: | Technical Analysis, Inc. |
| Address: | 4757 California Avenue SW |
| Seattle, WA 98116 | |
| Phone # for sales: | 206 938 0570 |
| Fax: | 206 938 1307 |
| Website: | www.traders.com |
| E-mail address: | DPenn@traders.com |
Traders' Resource Links | |
| Charting the Stock Market: The Wyckoff Method -- Books | |
| Working-Money.com -- Online Trading Services | |
| Traders.com Advantage -- Online Trading Services | |
| Technical Analysis of Stocks & Commodities -- Publications and Newsletters | |
| Working Money, at Working-Money.com -- Publications and Newsletters | |
| Traders.com Advantage -- Publications and Newsletters | |
| Professional Traders Starter Kit -- Software | |
PRINT THIS ARTICLE

|

Request Information From Our Sponsors
- VectorVest, Inc.
- Executive Premier Workshop
- One-Day Options Course
- OptionsPro
- Retirement Income Workshop
- Sure-Fire Trading Systems (VectorVest, Inc.)
- Trading as a Business Workshop
- VectorVest 7 EOD
- VectorVest 7 RealTime/IntraDay
- VectorVest AutoTester
- VectorVest Educational Services
- VectorVest OnLine
- VectorVest Options Analyzer
- VectorVest ProGraphics v6.0
- VectorVest ProTrader 7
- VectorVest RealTime Derby Tool
- VectorVest Simulator
- VectorVest Variator
- VectorVest Watchdog
- StockCharts.com, Inc.
- Candle Patterns
- Candlestick Charting Explained
- Intermarket Technical Analysis
- John Murphy on Chart Analysis
- John Murphy's Chart Pattern Recognition
- John Murphy's Market Message
- MurphyExplainsMarketAnalysis-Intermarket Analysis
- MurphyExplainsMarketAnalysis-Visual Analysis
- StockCharts.com
- Technical Analysis of the Financial Markets
- The Visual Investor


