HOT TOPICS LIST
- Strategies
- Stocks
- Buy
- Investing
- Brokers
- Psychology
- Interviews
- Accumulate
- Sell
- Hold
- Spotlight
- Websites
- Candlestick Corner
- Gold & Metals
- Options Trading
LIST OF TOPICS
FOCUS ON
Kings Of Commodities
08/13/03 12:43:55 PM PSTby David Penn
The dollar's turnaround will challenge the bull markets in gold: both black and yellow.
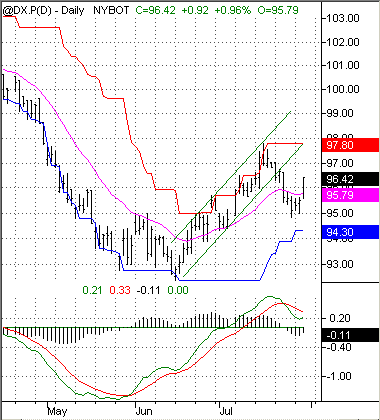
| In a number of articles for Working Money, I have tried to underscore the likelihood of a rebound in the plunging US dollar — which fell from a high of 122 in early 2001 (basis the US Dollar Index) to as low as 93 in the spring of 2003. First in "Down Goes The Dollar" and more recently in "Dollars, Debt, Stocks, and Things," I made the case that even in a world of rapidly growing money supply (courtesy of Federal Reserve Board chairman Alan Greenspan's commitment to "monetary accommodation"), the possibility that the dollar's precipitous drop would end abruptly (and perhaps surprisingly so) was greater than many "dollar-doomsayers" dared believe. Since June 2003, a number of things have happened that support this change in the dollar's trend. Global currencies — both financial currencies like the euro and Swiss franc as well as "resource" currencies such as the Australian and Canadian dollars — have all weakened significantly against the US dollar. The financial currencies were the first to break ("Head And Shoulders Top In European Currencies"), but the aussie and the loonie have similarly developed topping patterns that strongly suggest that their bull markets may be at an end. The spike in long-term interest rates — the reasons for which appear to have confused many observers — is another positive for the dollar. It is interesting to recall those who claimed — erroneously — that a weak dollar was "good" for the economy (and, by extension, "good" for stocks), and to wonder whether their reasoning would now indicate that a strengthening dollar is now "bad" for the economy. While there are some advantages to a relatively weak dollar from a global rebalancing perspective (as Morgan Stanley economist Stephen Roach has perceptively noted), the benefits of weak or strong dollars must be seen in the context of the economies in which they take place.
Figure 1: A dramatic turnaround in the dollar comes as global currencies weaken and long-term interest rates in the US reach a bottom.
As Stephen Roach wrote recently in a piece for the Morgan Stanley Global Economic Forum called "Rebalancing Delayed":
Global rebalancing is all about the restoration of a more sustainable equilibrium for a lopsided US-centric world economy. As I see it, only by shifting the mix of consumption from America to the rest of the world can the global economy avoid the painful endgame of a serious balance-of-payments crisis. For a while I was becoming encouraged that this scenario was playing out according to script. Now I am beginning to fear that the world is digging in its heels and resisting global rebalancing.
Part of the formula for rebalancing, in Roach's opinion, is a dollar that is significantly weaker than it was in 2000 and 2001. In fact, current dollar levels are compatible with those suggested by Roach as more consistent with a world economy that is becoming less dependent on the US. Unfortunately, and not too ironically, the rally in global equities markets ("The Reflation Trade") has only encouraged many to return to the same old pattern and habit of overreliance on US consumption (read: US borrowing and spending). Imagine a gambler who has spent hours losing money at the blackjack tables. Suddenly, the gambler wins a few hands, perhaps cutting his overall losses by as much as 25%. But instead of walking away from the table, glad to have won at least some of his money back, the gambler decides that the recent string of wins means that his "mojo" is back. The gambler starts gambling with both hands and feet in an attempt not just to get even, but to get ahead — maybe even way ahead. Unfortunately for this gambler — as with most gamblers — the winning streak is short-lived and the gambler ends up even deeper in the hole. This has been the attitude toward the rally in stocks worldwide. Rather than seeing the strength in equities as an opportunity to rebalance, too many — at the level of both individual investor and central banker — have taken the rally as a sign that happy days are here again.
BULLS, BEARS, AND BLACK GOLDOne of the other strong signs of a dollar recovery comes in the form of the commodities markets, particularly gold and crude oil. Both gold and crude reached vertigo-inducing heights early in 2003, with gold futures well over $380 an ounce and crude oil futures over $31 a barrel. Interestingly, it was not these February peaks that developed simultaneously with the dollar bottom, but the secondary peaks in both gold and crude oil that appear to be forming some six months later. I'll explain why I hesitate to suggest that these secondary peaks have been completed. But for now, note that the February highs in gold and crude oil did not mark the bottom in the dollar, and if the current rallies in both commodities do not take out the February highs, then it is likely that the secondary rally peaks in crude oil and gold in the summer of 2003 will, in fact, have marked a bottom in the dollar.
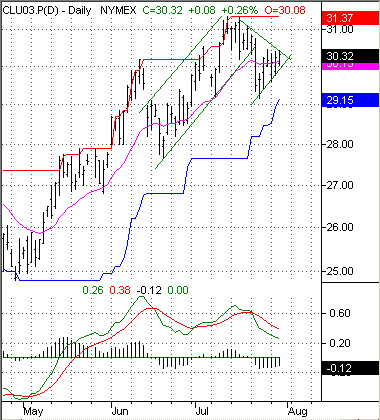
Figure 2: Breaking below a five-week trend channel and into what appears to be a symmetrical triangle top, September crude may be ripe for a reversal. Note also the negative divergence with the MACD in June and July.
The case against crude oil may be clearer than the case against gold. Crude oil had been in a soaring uptrend since the autumn of 2002, when bullish psychology — built in large part on fears of what a US/UK-led invasion of Iraq might mean to world oil production and supply — became a dominant force. Crude oil (basis September 2003) rose from less than $24 a barrel in November 2002 to more than $31 a barrel by the end of February 2003 — an increase of almost 30%. But as the invasion of Iraq became a reality, crude oil prices swooned, falling to less than $25 a barrel in mid-April. Unfortunately, the enduring low crude oil prices some cynical critics claimed was the secret reason for the invasion of Iraq did not materialize, as crude oil prices were moving back up strongly by May and were once again above $31 a barrel by early July. And what of the case for a reversal? Technically, crude oil has been moving down to sideways for most of July 2003, breaking through a five-week upward trend channel near the end of the month. The combination of this down-to-sideways movement and the recent peak just north of $31 has resulted in the formation of a symmetrical triangle. While symmetrical triangles are consolidation patterns capable of breaking out to either the upside or the downside, the proximity of crude oil's previous, late February peak (which is about 20 cents higher than the more recent peak) suggests that there is significant resistance at these levels, and fewer buyers willing to bid crude oil much higher — at least for now. An important addendum to the case for a bearish reversal in crude oil is the negative divergence between crude oil's June peak, its July peak, and the moving average convergence/divergence (MACD) indicator. Even though, in price terms, the July peak in crude oil is higher than the June peak, their respective MACD peaks show just the opposite: the June MACD peak is higher than the July MACD peak. Put simply, this negative divergence — bearish indicator versus bullish prices — points to lower crude oil prices rather than higher ones going forward. Such a development, it goes without saying, would be particularly bullish for the US economy and for the US dollar.
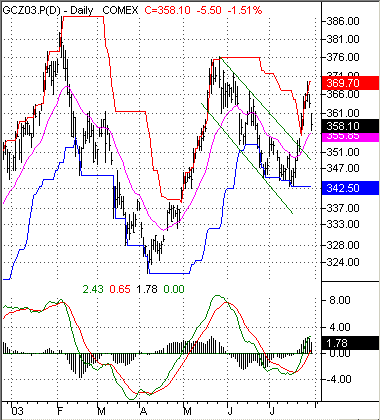
THE GOLD GAMEGold is somewhat trickier to assess than crude oil in this regard. In many ways, the pattern in gold futures in the first few months of 2003 was similar to the pattern in crude oil futures. Gold (basis December) peaked at $387.50 an ounce in early February 2003, just weeks before crude oil's peak, and put in a bottom at $321.30 in early April — again, less than a month before crude oil's bottom. While both gold and crude rallied again strongly into the late spring and early summer, gold experienced a sharp, 8% correction in late May, falling from $376 to $343 by mid-July. Since then, gold has moved back up, breaking a nine-week, downward trend channel, and climbing to just short of $370 before again correcting slightly near the end of the month.
Figure 3: Is gold correcting or advancing? A successful test of the May highs — or the July lows — will tell investors a great deal about gold's fortunes.
Is gold in an extended corrective mode? Until gold takes out the January high above $387, the answer to that question remains "Yes." Gold has also put in a significant lower high in May at $376, and until gold rallies above this point, the pattern of lower highs points strongly to lower gold prices going forward. However, many of the technical tools that were helpful with crude oil are either less helpful with gold or point to the opposite conclusion — that is, higher gold prices, at least in the short term. The first of these tools is the late May to mid-July downward trend channel, which gold broke out of strongly to the upside in July. As gold pulls back toward the top of this trend channel, it will be important to see whether the topmost part of this channel becomes support for a continued advance in gold. Support might also develop on the back of the 20-day EMA shown here. Another potentially bullish sign for gold is the fact that the MACD peaks in late January and late May are roughly equal — even though the January gold peak was clearly higher than the peak in May. While not necessarily a bullish sign, it would be reasonable to expect the May MACD peak to be lower than the one in January if, in fact, gold prices were headed lower for any significant period of time. One last technical issue to consider is that the nine-week, downward trend channel in gold might act like a bullish flag formation. In his classic text on pattern recognition, Encyclopedia Of Chart Patterns, Thomas Bulkowski notes that flag formations tend to last no more than three weeks. Beyond that, he suggests, an extended flag of more than three weeks' duration may be more of a rectangle, symmetrical triangle, or rising wedge. Unfortunately, there is nothing in that late spring/early summer trend channel that resembles any of Bulkowski's alternatives to the flag formation. But looking at the way gold has traded as a whole since the February peak, there is an argument that the rally from the trend channel has completed a symmetrical triangle top that is some $60 from the highest part of the formation to the lowest.
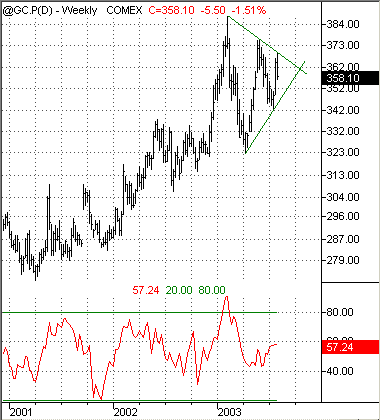
Figure 4: Could the current consolidation in gold be taking the form of a symmetrical triangle? Note that money flow is declining as the consolidation continues.
What would be required for gold to complete a symmetrical triangle in this weekly chart? Most important, the boundaries of the upward and downward trendlines would have to remain intact. At this point in the triangle's development, this also means that gold's recent price ranges would have to contract dramatically — from $60 at the beginning of the formation to less than $20 over the next few weeks (the range as of this writing is about $28). If gold were to continue to shrink its price range, then a symmetrical triangle would be all but assured. Of course, what would not be assured would be the direction of any subsequent breakout. An upside breakout — based on a convergence and breakout point of about $360 — would mean a gold price (basis continuous futures) in the neighborhood of $420. A downside breakout would take gold prices perilously close to the $300 level not seen since early in 2002.
KING DOLLAR REVISITEDThe evidence for a higher dollar continues to be compelling. Even the most dollar-bearish scenario depicted here, the scenario in which gold rises to $420, may only be a temporary victory against the greenback. Gold moving to $420 would not be the start of a new gold move, but would more likely represent the end of the initial gold move off its major long-term lows around $270 back in 2001. If gold were to make such a move, then watching to see whether the dollar — which would undoubtedly be falling during such an event — successfully tests its June lows just south of 93 would be important. If gold were to advance above $400, then it is no exaggeration to say that gold bugs would be in a frenzy of delight, their bullish exuberance perhaps becoming almost palpable. Even Robert Prechter, who maintains a bearish stance on gold in the near term, has suggested that gold over $400 would be cause for him to consider reconsidering his analysis. However, even if gold advances above $400, if the US dollar index does not make a new low, then those exuberant gold bugs may do themselves a service by keeping their enthusiasm in check and their stop-sell orders close at hand. Something similar could be said for those who see the continuing troubles in "winning the peace" in Iraq, or skyrocketing demand from Asia, as reasons for higher crude oil prices now. Crude oil is also in the latter stages of its bull market, not the early stages. And every new post-rally consolidation is another opportunity for distribution and risk of reversal. If there is a truly young — albeit perhaps ultimately short-lived — bull market, then that bull market — in the summer of 2003 — would be in the US dollar. Much maligned in the spring of this year as it plunged to lows not seen since the mid-1990s, the US dollar still remains well within the comfort zone (roughly 10090) it has retreated to in the wake of both upside (1985-86; peaked out at 165) and downside (1992; bottomed at 80) excesses. This relative stability, if it were to endure, might in and of itself be enough to attract more buyers to the greenback. Of course, too much attraction to the dollar — by way of rising interest rates in the US; declining currencies globally, but especially in Europe and Asia; or falling commodities prices in leaders like gold and crude oil — would have the effect of, on balance, increasing the value of the dollar just as it was moving toward what Stephen Roach, among others, considered a more sustainable level. All this about the dollar should not obscure some of the very real fundamental problems with the greenback — whether they are related to massive and growing federal budget deficits, the complete lack of spending restraint in Congress and the White House, or even the alienation and resentment many allege the world feels toward the US. Indeed, as I noted in "Down Goes The Dollar," the long-term macro-historical trend of the dollar is down — and quite decidedly so. This "secular inflation," which critics of the Federal Reserve system insist began decades ago in the wake of the Great Depression, remains the uber-trend for the dollar and all of the dollar's movements should be seen in this context. Nevertheless, it is interesting to note how the din of "dollar doomsaying" has not morphed over into eagerness about what a stronger dollar might do for the economy, or for savers bled dry by artificially low interest rates, but instead has simply vanished, as if the thesis of an ever-declining dollar hadn't been advocated in the first place. There is nothing to worry about, however. As soon as the dollar's rally is done — next week, next month, next year — the "dollar-doomsayers" will be back, and maybe, this time they'll be right.
David Penn may be reached at DPenn@Traders.com.
SUGGESTED READINGBulkowski, Thomas N. [2000]. Encyclopedia Of Chart Patterns, John Wiley & Sons.Penn, David [2003]. "Dollars, Debt, Stocks, And Things," Working Money: July. _____ [2003]. "Head & Shoulders Top In European Currencies," Traders.com Advantage: June. _____ [2003]. "The Reflation Trade," Working Money: June. _____ [2003]. "Down Goes The Dollar," Working-Money: February. Roach, Stephen [2003]. "Rebalancing Delayed," Global Economic Forum, Morgan Stanley Dean Witter: July. TradeStation (TradeStation Technologies)
Current and past articles from Working Money, The Investors' Magazine, can be found at Working-Money.com.
|
Technical Writer for Technical Analysis of STOCKS & COMMODITIES magazine, Working-Money.com, and Traders.com Advantage.
| Title: | Traders.com Technical Writer |
| Company: | Technical Analysis, Inc. |
| Address: | 4757 California Avenue SW |
| Seattle, WA 98116 | |
| Phone # for sales: | 206 938 0570 |
| Fax: | 206 938 1307 |
| Website: | www.traders.com |
| E-mail address: | DPenn@traders.com |
Traders' Resource Links | |
| Charting the Stock Market: The Wyckoff Method -- Books | |
| Working-Money.com -- Online Trading Services | |
| Traders.com Advantage -- Online Trading Services | |
| Technical Analysis of Stocks & Commodities -- Publications and Newsletters | |
| Working Money, at Working-Money.com -- Publications and Newsletters | |
| Traders.com Advantage -- Publications and Newsletters | |
| Professional Traders Starter Kit -- Software | |
PRINT THIS ARTICLE

Request Information From Our Sponsors
- VectorVest, Inc.
- Executive Premier Workshop
- One-Day Options Course
- OptionsPro
- Retirement Income Workshop
- Sure-Fire Trading Systems (VectorVest, Inc.)
- Trading as a Business Workshop
- VectorVest 7 EOD
- VectorVest 7 RealTime/IntraDay
- VectorVest AutoTester
- VectorVest Educational Services
- VectorVest OnLine
- VectorVest Options Analyzer
- VectorVest ProGraphics v6.0
- VectorVest ProTrader 7
- VectorVest RealTime Derby Tool
- VectorVest Simulator
- VectorVest Variator
- VectorVest Watchdog
- StockCharts.com, Inc.
- Candle Patterns
- Candlestick Charting Explained
- Intermarket Technical Analysis
- John Murphy on Chart Analysis
- John Murphy's Chart Pattern Recognition
- John Murphy's Market Message
- MurphyExplainsMarketAnalysis-Intermarket Analysis
- MurphyExplainsMarketAnalysis-Visual Analysis
- StockCharts.com
- Technical Analysis of the Financial Markets
- The Visual Investor


