HOT TOPICS LIST
- Strategies
- Stocks
- Buy
- Investing
- Brokers
- Psychology
- Interviews
- Accumulate
- Sell
- Hold
- Spotlight
- Websites
- Candlestick Corner
- Gold & Metals
- Options Trading
LIST OF TOPICS
FOCUS ON
The Count Right Now
03/03/04 03:47:39 PM PSTby David Penn
An hourly Elliott wave count of the S&P 500 late in February suggests higher prices in March.
| The price action in the Standard & Poor's 500 over the last few months evaded my initial efforts to fasten to it an Elliott wave count with which I felt completely comfortable. Looking at the S&P 500 of late, I feel some of what Elliott wave technicians like Robert Prechter must have felt back in 1995, 1997, or 1999. And having believed that the S&P 500 was making a major top almost one year ago to the month -- only to find myself finally submitting to the power of the bull by June -- I find myself back in the uncomfortable position of "worrying the upside" in the S&P 500 going forward in 2004.
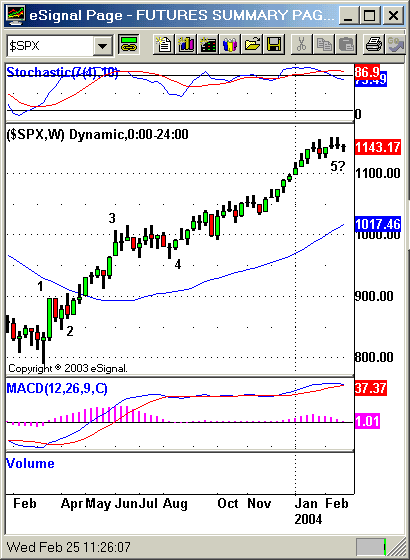
Figure 1: Many Elliotticians see in the S&P 500's most recent peak the end of a primary 2 bear market rally that began back in October 2002. Shown here is the final wave "c" of that primary 2 wave.
First, what I believe to be the good news. I've been plotting a five-wave pattern in the S&P 500, a pattern that springs from the mid-October 2003 lows. Note that this count takes place in the context of a minor fifth wave that itself began with the early August 2003 lows. Thus the waves discussed here are of the minute, minuette, and subminuette variety. Here are the minute waves of this minor fifth. All numbers have been rounded off, and dates have been approximated for ease of comparison.
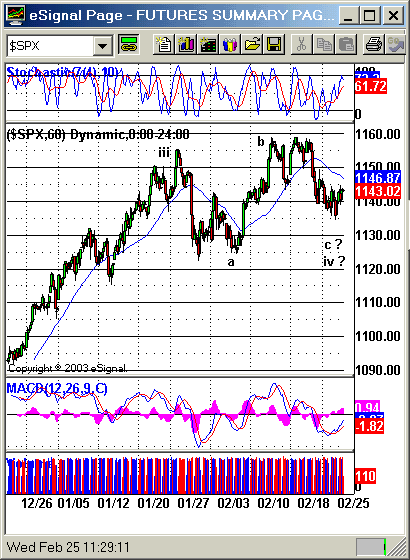
As the saying goes, your mileage may vary. But this count represents my best effort at keeping up with what could be a seismic event in the S&P 500: the completion of the primary wave 2 bull market that began in the S&P 500 in March 2003. There are three principal Elliott wave corrective patterns: the zigzag, the triangle, and the flat. Looking closer at the minute "iv" wave, it appears that price action has taken the form of a flat. Flats are distinguished by being typically sideways movements (compared to zigzags, which are often sharp and abrupt). Flats are composed of three waves: the first has three parts, the second has three parts, and the third has five parts (3-3-5). Considering the minute "iv" (January 26 through at least February 25, the date of this writing) as a flat, we have an initial, minuette "a" wave down from the late January highs to the lows near the beginning of February. The "b" wave explodes up from the early February lows to challenge the January highs by February 11. The S&P 500, by my analysis, is currently in a minuette "c" wave that should move no lower than the low of the minuette "a" wave — a low of approximately 1122.
Figure 2: This wave count in the minute "iv" 3-3-5 flat suggests limited downside for the S&P 500 at this juncture.
If this Elliott wave count is accurate, then we should be able to anticipate a region in which the minute "v" wave will conclude. This, unfortunately, is where the bad news comes in. A minute "v" top would also represent a minor 5 top, and that would herald both the end of the intermediate (b) bull market that began in March 2003, as well as the primary 2 bull market that began in October 2002. As I've mentioned in other Traders.com Advantage and Working Money articles, Robert Fischer's method for projecting wave five limits is one effective way to "game" the upside in a given Elliott wave count. Fischer's method, detailed in his book Fibonacci Applications And Strategies For Traders, involves multiplying the length of wave one by 1618 and adding that sum to the value at the end of wave one. Second, Fischer calls for multiplying the length of wave three (as measured from the bottom of wave one) by 0.618, and adding that sum to the value at the end of wave three. I have found that averaging these two numbers is the best way to arrive at a likely price target for the completion of the five-wave movement. Thus, minute "i" form 961 to 1040 was approximately 79 points; 79 x 1.618 = 127.82, and 1040 + 127.82 equals 1167.82. Minute "iii" from 961 to 1155 was approximately 194 points (again, as measured from the beginning of wave one); 194 x 0.618 = 119.89, and 1155 + 119.89 equals 1274.89. So the likely upside range for minute "v" is 1168 to 1275. Averaged together, the upside target for a minute "v" peak is around 1222.
COUNTERING THE WAVE COUNTThis represents some problems for traditional Elliott wave analysis. Were the S&P 500 to hit 1222, then it would take out the cycle B high made in late March 2002 at 1174. (A reminder: Cycle A lasted from the beginning of the bear market in 2000 until the September 2001 lows; cycle B lasted from the September 2001 lows to the March 2002 highs.) Suffice it to say that Elliott wave theory would suggest that this — prices in cycle C taking out the highs of cycle B — is unlikely in the extreme. In addition, I should note that previous projections of the primary 2 top were significantly lower. Doing the same projection calculations using the minor waves provides an upside range of 1155 to 1069. As of this writing, the S&P 500 has climbed just short of 1159. Combining this with the fact that prominent Elliotticians and Fibonacci-oriented traders have called for a market top around this time and at this price, what — beyond these new projections based on even smaller subwaves — is the argument for the S&P 500 to continue to move even higher? As I have suggested elsewhere, if there is one criticism that can be consistently leveled against many Elliott wave theorists, that criticism might be that their projections often do not allow enough room for markets to do the unexpected — especially to the upside. Whether this is particularly a function of Elliott wave analysis involving the stock market — as opposed to Elliott wave analysis of commodities such as gold or currencies — is an interesting question. If Elliott wave patterns represent, as its adherents claim, the ebb, flow, and evolution of human emotion from anxiety, fear, and despair to confidence, hope, and — ultimately — greed, then that which is most synonymous with the pattern of these emotions will also probably be that which is best and most accurately understood using the Elliott wave methodology. I have found pop culture to be a strong example of this (as have, of course, Prechter and the socionomists). Decades ago, Prechter made this observation in his Elliott Wave Principle in connection with an Elliott wave analysis of commodities in general and gold in particular, writing:
. . . We can demonstrate that commodities have properties which reflect the universal order that Elliott discovered. It seems reasonable to expect, though, that the more individual the personality of a commodity, which is to say, the less it is a necessary part of human existence, the less it will reliably reflect an Elliott pattern. But whatever the source, the informed critique of most Elliott wave analysis is that those who practice it tend to err on the side of waves being shorter in amplitude and duration rather than longer. To this end, I have tried to keep in mind other fundamental tenets of technical analysis — particularly the notion of trends being intact until they are proven to be reversing — and to insist that any Elliott wave analysis be compatible with those tenets I find most valuable (from Dow theory to using stochastic divergences to denote tops). This should be seen more as a way of confirming Elliott wave analysis than as a way to refute it, as A.J. Frost and Robert Prechter noted in 1978. For example, of Dow theory, the pair wrote:
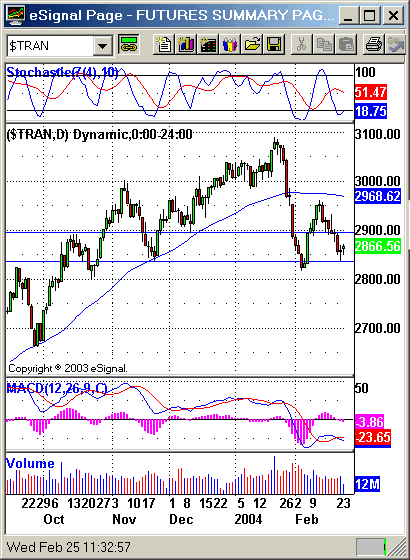
The Elliott Wave Principle, apart from the confirmation principle, has points in common with Dow Theory. . . . Both theories . . . are based on empirical observations and complement each other in theory and practice. Often, for instance, the Elliott count can forewarn the Dow Theorist of an upcoming non-confirmation . . . On the other side of the coin, a Dow Theory non-confirmation can often alert the Elliott theorist to examine his count to see whether or not a reversal should be the expected event. Thus, knowledge of one approach can complement application of the other. Since Dow Theory is the grandfather of the Wave Principle, it deserves great respect for its historical significance as well as its consistent record of performance over the years. It is Dow theory to which I have increasingly turned as the S&P 500 climbed higher. And it is Dow theory that, as of this writing, makes me less convinced that the S&P 500 has topped out in a primary 2 wave peak. Much of my recent commentary on the Dow averages has already been published in either Traders.com Advantage ("Confirmations And The January Highs," February 12, 2003; "Dow Theory Divergences," February 5, 2003) or Working Money ("The Coming Confirmation?" February 4, 2003). So I will avoid repeating myself here. However, to sum up the bullish case as suggested by my understanding of Dow theory, the uptrend in the markets is real and enduring as long as the two averages resist confirming any new lows the other registers — particularly the new lows set by the Dow transports. As the transports, for example, took out their December and November lows recently, the industrials remained resilient, their January lows intact to this day. While the renewed plunge in the transports in February has some concerned that the transports will have a difficult time confirming the industrials' January-beating February high, the fact remains that — from a Dow theory perspective — even this would be a nonconfirmation, meaning that the prevailing trend — which remains upward — would still be in effect.
Figure 3: The transports have been rocked, but without confirmation from the industrials, the bull market must be considered likely to continue.
Finally, it is worth noting that the Nasdaq, the Dow industrials, and the transports all have surpassed their March 2002 highs — barely. With regard to this benchmark, the S&P 500 is actually lagging behind. But if these projections are accurate — or even close, in the case of the more bullish projection based on minute "iii" — then the S&P 500 might not lag for long.
David Penn may be reached at DPenn@Traders.com.
SUGGESTED READINGFischer, Robert [1993]. Fibonacci Applications And Strategies for Traders, John Wiley & Sons.Frost, A.J. and Robert Prechter [1978]. Elliott Wave Principle, New Classics Library. Penn, David [2003]. "The Coming Confirmation?" Working Money: February. _____ [2003]. "Dow Theory Divergences," Traders.com Advantage: February. _____ [2003]. "Confirmations And The January Highs," Traders.com Advantage: February. _____ [2002]. "The Rally Rolls On," Working Money: November. Charts courtesy TradeStation
Current and past articles from Working Money, The Investors' Magazine, can be found at Working-Money.com.
|
Technical Writer for Technical Analysis of STOCKS & COMMODITIES magazine, Working-Money.com, and Traders.com Advantage.
| Title: | Traders.com Technical Writer |
| Company: | Technical Analysis, Inc. |
| Address: | 4757 California Avenue SW |
| Seattle, WA 98116 | |
| Phone # for sales: | 206 938 0570 |
| Fax: | 206 938 1307 |
| Website: | www.traders.com |
| E-mail address: | DPenn@traders.com |
Traders' Resource Links | |
| Charting the Stock Market: The Wyckoff Method -- Books | |
| Working-Money.com -- Online Trading Services | |
| Traders.com Advantage -- Online Trading Services | |
| Technical Analysis of Stocks & Commodities -- Publications and Newsletters | |
| Working Money, at Working-Money.com -- Publications and Newsletters | |
| Traders.com Advantage -- Publications and Newsletters | |
| Professional Traders Starter Kit -- Software | |
PRINT THIS ARTICLE

Request Information From Our Sponsors
- StockCharts.com, Inc.
- Candle Patterns
- Candlestick Charting Explained
- Intermarket Technical Analysis
- John Murphy on Chart Analysis
- John Murphy's Chart Pattern Recognition
- John Murphy's Market Message
- MurphyExplainsMarketAnalysis-Intermarket Analysis
- MurphyExplainsMarketAnalysis-Visual Analysis
- StockCharts.com
- Technical Analysis of the Financial Markets
- The Visual Investor
- VectorVest, Inc.
- Executive Premier Workshop
- One-Day Options Course
- OptionsPro
- Retirement Income Workshop
- Sure-Fire Trading Systems (VectorVest, Inc.)
- Trading as a Business Workshop
- VectorVest 7 EOD
- VectorVest 7 RealTime/IntraDay
- VectorVest AutoTester
- VectorVest Educational Services
- VectorVest OnLine
- VectorVest Options Analyzer
- VectorVest ProGraphics v6.0
- VectorVest ProTrader 7
- VectorVest RealTime Derby Tool
- VectorVest Simulator
- VectorVest Variator
- VectorVest Watchdog


