HOT TOPICS LIST
- Strategies
- Stocks
- Buy
- Investing
- Brokers
- Psychology
- Interviews
- Accumulate
- Sell
- Hold
- Spotlight
- Websites
- Candlestick Corner
- Gold & Metals
- Options Trading
LIST OF TOPICS
MARKET COMMENTARY
How The Dollar Gets Its Groove Back
03/24/04 11:36:22 AM PSTby David Penn
Near-term rallies in the euro and aussie may presage a rally in the US dollar.
| If you listen closely, you may be able to hear the thumping in the chests of the US dollar's chief antagonists — the gold bugs and foreign-currency aficionados who have been living large off of the dollar's declines over the past years. But those heart palpitations are increasingly less those of giddy excitement and more those of anxiety and dread as a dollar that previously seemed incapable of anything but collapse suddenly appears to be equally incapable of moving appreciably lower. While still a minority position, the case for a dollar rally has been made frequently in Working Money, particularly in a string of articles I wrote in the second half of 2003 (see "Pimping the Dollar" posted online in January 7, 2004, and "Fading the Greenback" posted online in October 15, 2003). In October 2003, the dollar was trading in the low 90s (basis continuous futures), and actually appeared as if it were forming a bottom. Nevertheless, after a sharp rally that took the dollar to a test of resistance at the 50-day exponential moving average, the greenback resumed its descent — falling from just above 94 in late October 2003 to as low as 85 in January 2004. It is the February 2004 lows that appear to mark a bottom — however temporary it may prove to be — in the greenback's multiyear decline. Unlike the consolidation in October 2003, which lasted some six weeks before breaking down, the consolidation in 2004 is at least two months in duration. The current consolidation also has the advantage of seeing dollar prices break through the 50-day EMA in late February and successfully test that level for support in March. However, one of the best ways to confirm price action in currencies — especially the dollar — is to look for contrary signals in "opposing" currencies. If a trader or investor believes there is a bottom forming in the dollar, then he or she should be able to find topping formations in currencies such as the euro, the Australian dollar, the Japanese yen, the Canadian dollar, and so on.
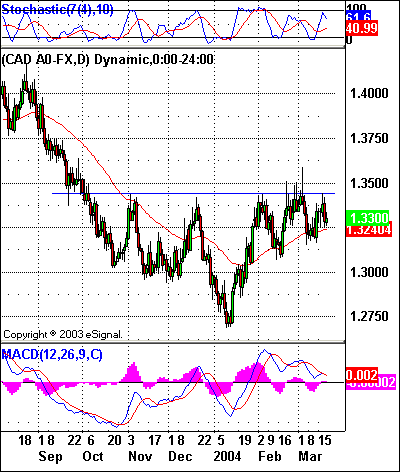
RESOURCE CURRENCIES RUNNING ON EMPTY?While a great deal of attention has been paid to the euro, a number of savvy antidollar traders have spent more time over the past year accumulating "resource" currencies like the Australian and Canadian dollars. They are considered "resource" currencies because, while not actually backed by gold or indexed to a basket of commodities, the economies of Australia and Canada are sensitive enough to commodity prices that their currencies tend to be disproportionately sensitive to shifts in these prices. If there was a break in the great run that resource currencies have had against the dollar, then the first crack might have been in the US dollar/Canadian dollar, which appears to have bottomed on January 9 at 1.2684. Since that time, USD/CAD has appreciated significantly, moving above its 50-day exponential moving average (EMA) late in January, testing that level for support in early February, and testing it again in early March to a recent close of 1.3282. In fact, there is a strong argument that USD/CAD has traced out a six-month head & shoulders bottom that could send USD/CAD to as high as 1.4316 in an initial move upward. Such an advance would make for a test of the April 2003 highs.
Figure 1: This six-month head & shoulders bottom in USD/CAD suggests an improvement in the dollar's fortunes against the loonie.
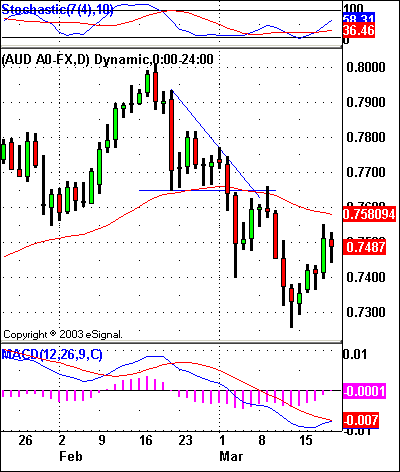
Intimations of a reversal are also present in Australian dollar/US dollar, where a strong rally that began in late August 2003 has begun showing signs of faltering. The clearest indication of this growing weakness in AUD/USD is the way prices broke down beneath their 50-day exponential moving average in early March 2004. Underscoring this breakdown was the inability — as of this writing — of AUD/USD to rally back up above a 50-day EMA that now provides resistance where it once provided support. From a peak of 0.8008 in early February, AUD/USD fell as far as 0.7255 by early March, taking out year-to-date lows. The initial breakdown took the form of a seven- or eight-day descending triangle and projected a low of 0.7357. This low was reached fairly swiftly; breaking down on March 2, AUD/USD had a closing low of 0.7330 on March 12. This was the low of the breakdown; AUD/USD has since rallied to test resistance at the 50-day EMA.
Figure 2: After reaching its downside objective, AUD/USD rallies back toward a test of resistance at the 50-day EMA. Note the positive divergence in the stochastic.
Will the AUD/USD's current advance continue? There is significant resistance not only in the form of the 50-day EMA, but also from the trough lows in January at the 0.7535 area. Even if the AUD/USD does surpass this level, there are bearish portents in the MACD histogram (MACDH) that have formed deep troughs in the wakes of rallies in mid-January and mid-February. The size and direction (up or down) of these troughs — as I have noted elsewhere and as technicians like Alexander Elder have explained (see his excellent book Trading For A Living) — suggest that there is a great deal of selling strength in the AUD/USD market at this time, and that any rallies in the immediate future might likely be sellable rallies.
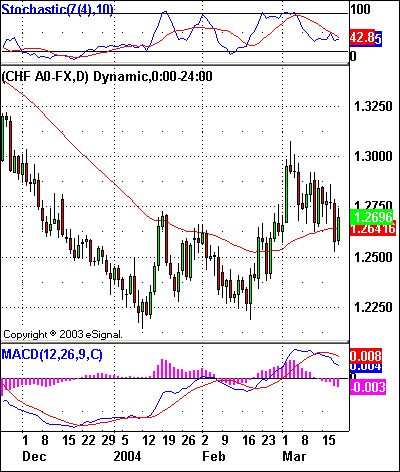
POUND SHORT AND FRANC FOOLISH?The "finance" currencies — the euro, the British pound, and the Swiss franc — have also appreciated against the dollar. And while the two groups of currencies — resource and finance — are often talked about as discrete units, their performance vis-à-vis the greenback has been significantly similar. In fact, a chart of the Swiss franc (USD/CHF) looks almost exactly like a chart of the US dollar index, complete with October 2003 consolidation and January-March 2004 consolidation/bottom. Those looking to play the dollar, but not interested in playing US dollar index futures, could do little better than to make the US dollar/Swiss franc the vehicle of choice. Like the dollar index, USD/CHF broke out above its 50-day EMA in mid- to late February 2004 and has, so far, successfully tested the 50-day as support going into March. The ability of the 50-day EMA to continue to provide support will be pivotal to the near-term direction of the USD/CHF.
Figure 3: Will the USD/CHF find support at the 50-day EMA? MACDH peaks suggest higher prices for USD/CHF going forward.
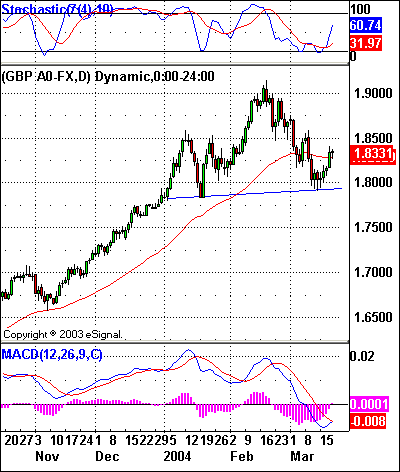
It also might be worthwhile to note the behavior of the MACDH, which was particularly strong (that is, sizable peaks) during the rally attempts in January and late February/early March. Given the weakness of the intervening troughs, we can infer from the MACDH's behavior that there is significantly greater strength among buyers of USD/CHF than there is among sellers. This, I want to emphasize, does not mean that USD/CHF might not move down again, perhaps below the 50-day exponential moving average. But the MACDH is announcing that, until further notice (that is, deeper MACDH troughs), the bulls are gaining control of USD/CHF. Having already discussed the euro in a Working Money article ("Symmetrical Triangles And The MACDH") that is pending and not yet posted and with an insightful piece on the yen recently added to Traders.com Advantage (see Ashwani Gujral's "Japanese Yen Futures Ready For More Downside" posted on March 18, 2004), I won't comment directly on either of those two major currencies here. But I will end this section with a brief discussion of the British pound, which shares many similarities with the euro. Mid-September 2003 was a breakout period for the British pound as it moved resolutely above its 50-day exponential moving average after a correction that began months earlier in July. Breaking out at 1.6000, the British pound/US dollar rallied strongly over the next several months, not once closing (on a daily basis) below its 50-day EMA. It was not until mid-February 2004 that it appeared GBP/USD had finally peaked out at 1.9141 — a gain of more than 30 cents since mid-September. Since this peak, the British pound has sunk, finally closing beneath its 50-day EMA in early March. Falling to near 1.8000, GBP/USD is currently making an effort to rally back against the now-resistance level of the 50-day EMA. Because GBP/USD has in fact closed marginally above that intermediate-term moving average in mid- March, there is a likelihood that the currency will be able to advance higher — perhaps testing the March high at 1.8586 before moving on to a confrontation with the historic highs established in February. Given the pattern that GBP/USD may have traced out since the beginning of the year — a pattern that looks suspiciously like the left shoulder and head of a head & shoulders top — it will be worthwhile to see if GBP/USD does rally a few points higher, establishing a fully formed right shoulder. With a high in the left shoulder of approximately 1.8581, GBP/USD's current five-day rally shouldn't take prices too much higher than that — if a head & shoulders top is to take place.
Figure 4: A head & shoulders top in the GBP/USD could send prices down to a test of the November 2003 lows near 1.6500.
It is worth noting that the MACDH is reflecting growing strength on the part of the sellers of GBP/USD. If GBP/USD continues to rally in the near term, it will be important to note the strength of that rally as reflected by a MACDH peak. If that peak is relatively low, then there is an increased likelihood that GBP/USD will move lower, as well.
IS WHAT'S GOOD FOR GLOBALS GOOD FOR THE GREENBACK?Earlier, I suggested that rallies in global currencies like the Swiss franc, the pound, the aussie, and the loonie might anticipate rallies in the US dollar. How could this be so, when the discussion so far has, if nothing else, underscored the point that these currencies trade contrary to the greenback? The answer lies in the notion that while the aforementioned global currencies are topping, the greenback is likely bottoming — again, at least on an intermediate-term basis. What appears to be happening is that the global currencies are, in most instances, experiencing their first significant post-break rallies — their "B" waves, if you will — to borrow from Elliott wave terminology. (The "A" wave would be the various breaks beneath the 50-day exponential moving averages I pointed out earlier.) As such, it is reasonable to expect that the current rallies in these global currencies will continue to fight their way higher, even if that way is increasingly upstream. Meanwhile, the dollar will likely be doing the same work — only in reverse. While the pound and aussie, for example, are attempting to retest recent highs, the dollar (and the USD/CHF and USD/CAD) will likely be testing recent lows. At this stage, whether any of these extremes will be reached is difficult to know — but traders should be on guard for the possibility of prices either rallying to old highs or dropping to old lows in the near term. But if those old highs and lows are not exceeded by near-term price action, then there is an excellent chance that the reversals suggested by the technicals in each of these instances will manifest themselves over the coming weeks and months.
David Penn may be reached at DPenn@Traders.com.
SUGGESTED READINGElder, Alexander [1993]. Trading For A Living, John Wiley & Sons.Gujral, Ashwani [2004]. "Japanese Yen Futures Ready For More Downside," Traders.com Advantage: March 18. Penn, David [2004]. "Symmetrical Triangles And The MACDH," Working-Money: March 24. _____ [2004]. "Pimping The Dollar," Working Money: January 7. _____ [2003]. "Fading The Greenback," Working Money: October 15.
Charts courtesy eSignal
Current and past articles from Working Money, The Investors' Magazine, can be found at Working-Money.com.
|
Technical Writer for Technical Analysis of STOCKS & COMMODITIES magazine, Working-Money.com, and Traders.com Advantage.
| Title: | Traders.com Technical Writer |
| Company: | Technical Analysis, Inc. |
| Address: | 4757 California Avenue SW |
| Seattle, WA 98116 | |
| Phone # for sales: | 206 938 0570 |
| Fax: | 206 938 1307 |
| Website: | www.traders.com |
| E-mail address: | DPenn@traders.com |
Traders' Resource Links | |
| Charting the Stock Market: The Wyckoff Method -- Books | |
| Working-Money.com -- Online Trading Services | |
| Traders.com Advantage -- Online Trading Services | |
| Technical Analysis of Stocks & Commodities -- Publications and Newsletters | |
| Working Money, at Working-Money.com -- Publications and Newsletters | |
| Traders.com Advantage -- Publications and Newsletters | |
| Professional Traders Starter Kit -- Software | |
PRINT THIS ARTICLE

Request Information From Our Sponsors
- StockCharts.com, Inc.
- Candle Patterns
- Candlestick Charting Explained
- Intermarket Technical Analysis
- John Murphy on Chart Analysis
- John Murphy's Chart Pattern Recognition
- John Murphy's Market Message
- MurphyExplainsMarketAnalysis-Intermarket Analysis
- MurphyExplainsMarketAnalysis-Visual Analysis
- StockCharts.com
- Technical Analysis of the Financial Markets
- The Visual Investor
- VectorVest, Inc.
- Executive Premier Workshop
- One-Day Options Course
- OptionsPro
- Retirement Income Workshop
- Sure-Fire Trading Systems (VectorVest, Inc.)
- Trading as a Business Workshop
- VectorVest 7 EOD
- VectorVest 7 RealTime/IntraDay
- VectorVest AutoTester
- VectorVest Educational Services
- VectorVest OnLine
- VectorVest Options Analyzer
- VectorVest ProGraphics v6.0
- VectorVest ProTrader 7
- VectorVest RealTime Derby Tool
- VectorVest Simulator
- VectorVest Variator
- VectorVest Watchdog


