HOT TOPICS LIST
- Strategies
- Stocks
- Buy
- Investing
- Brokers
- Psychology
- Interviews
- Accumulate
- Sell
- Hold
- Spotlight
- Websites
- Candlestick Corner
- Gold & Metals
- Options Trading
LIST OF TOPICS
FOCUS ON
Sugar, Sugar
04/21/04 04:11:50 PM PSTby David Penn
Has sugar finally joined the commodities bull market?
| A colleague noticed a number of long-, intermediate-, and short-term sugar price charts I'd laid out on my desk and he began telling me about the days of the big sugar bull markets in the 1970s. He recalled people mortgaging their homes just to buy more and more sugar futures contracts, as the sweet stuff rallied from a long-term consolidation range between five and 10 cents a pound to over 65 cents a pound at its peak in the autumn of 1974 (a peak that was coincident with the bear market bottom in stocks, by the way). Sugar is to the rest of the softs what silver is to the metals. Once a mainstay, sugar has seen its leading role challenged by a variety of substitutes, body-doubles, and changing sentiments. What digital photography has done to silver, one might argue, corn-based sweetening concoctions like high-fructose corn syrup (the notorious HFCS often blamed for the American obesity "epidemic") and a host of artificial others ranging from aspartame to Splenda have done to sugar. It is entertaining to read old predictions of the fate of sugar in this context. Writing in the 1980 CRB Commodity Year Book, for example, George T. Hirai noted:
The development of high fructose sweeteners, far from spelling the end for sucrose demand, probably comes upon the technological scene at precisely the right moment. With recent growing energy demands throughout the world and with the accompanying skyrocketing of prices for petroleum-based products, the sugar industry is presented with a major alternative outlet for its product.
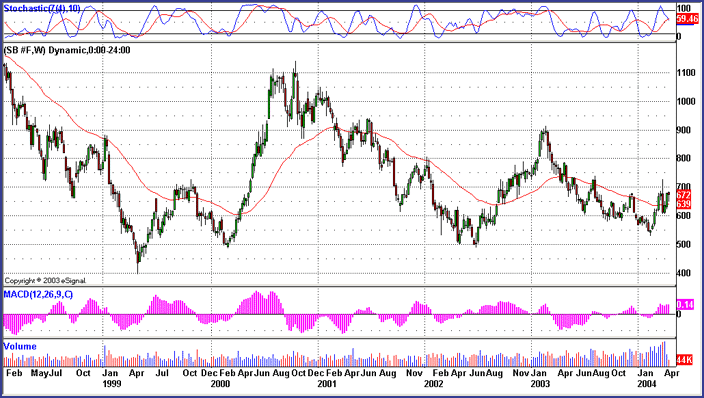
While Hirai should not be faulted for not owning a crystal ball, it should not escape us that those "skyrocketing prices for petroleum-based products" peaked in 1980 and declined into a bear market that lasted — at least — for 10 years. This alone would stem any pressure to find new alternative energy sources — in sugar, corn, or anywhere else. I should add that sugar also was making a major peak in 1980, with cash prices tapping 40 cents per pound before falling below the five-cent level by mid-decade. But while sugar prices have been low for some time — particularly since their sharp, surprising bull market from the spring of 1999 to the summer of 2000 — is it a given that sugar will remain down for the full count? In that bull move, sugar (basis continuous futures) rallied from about four cents a pound to over 11 cents a pound in about 18 months. That rally fizzled, and sugar spent the next two years giving back those gains, finally ending its decline in the early summer of 2002 at about five cents a pound. A rally from this low brought sugar prices as high as nine cents at the beginning of 2003, but once again, the bulls were repelled and sugar corrected to the five-and-a-half-cent area early in 2004. Sugar has made another bull move here in the spring of 2004, rising up from five and a half cents to as high as seven and a quarter cents (basis May futures) by mid-March. The correction from that mid-March high, however, was sharp and severe, stripping sugar futures of a cent and a quarter in a matter of days. The question for sugar is this. Since the early 1999 low, sugar has made a series of significant higher lows: in early 2000, the spring of 2002, and early in 2004. All else being equal, this would be a bullish development. However, at the same time, sugar has made a series of significant lower highs as well: with the early 2003 high falling far short of the late 2000 peak, and the 2004 high so far falling short of the early 2003 peak. This, again all else being equal, would be a bearish development. Which development will prevail (Figure 1)?
Figure 1: Long-term higher lows in sugar are bullish. But it will take a move above the 2003 highs for the bull market to get the respect it deserves.
Fortunately, technical analysis is in part about separating equal possibilities from those possibilities that might be "more equal than others" (to steal from Orwell's Animal Farm). In other words, those watching sugar have the guidepost of either a break in the series of higher highs or a break in the series of lower lows as a valuable tool in determining whether sugar is in a broadly bearish or broadly bullish phase. Thus, a move in sugar below five and a half cents — the February lows of the May contract — would suggest more downside, while a move in sugar above seven and a quarter cents — the March highs of the May contract — would suggest more upside.
Sugar: The trend-free sweetener?Writing about sugar in their book, The International Sugar Trade, authors A.C. Hannah and Donald Spence explain that sugar, as a commodity, is notable for its price volatility. Among the factors contributing to this volatility, according to Hannah and Spence, are:
A number of these factors are shared by other agricultural commodities. Yet the volatility of sugar is underscored by the work of market technicians George Pruitt and John and Lundy Hill in their book, The Ultimate Trading Guide. In this book, which among other things chronicles the profitability of a variety of commodities when traded with some of the more popular and/or profitably trading systems (such as the Donchian breakout, moving average crossover, and volatility range breakout), sugar performed at a relatively mediocre level — better than many of the grains in some of the systems, but worse than most other commodities such as bonds, currencies, and energies. A glance at long- and intermediate-term charts of sugar is further confirmation of sugar's stubbornness when it comes to adhering to trends. Even in a five-year chart — in which the lion's share of the noise of daily or even weekly price movement would be smoothed out — sugar is a jagged picture, with swift rocket-like rallies and staggered, halting, relentless declines. If a bull market in sugar is a leap over tall buildings in a single bound, then a bear market in sugar is a fall down several flights of stairs, with the descent characterized by a painful collision with every single step on the way down.
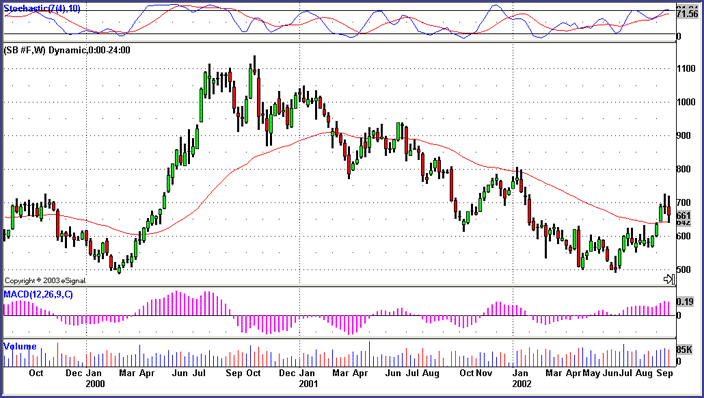
Sweet MACDH extremesGiven sugar's relatively trend-agnostic behavior — certainly when looked at over the past five years — moving average-based approaches to trading sugar are as likely to lead to frustration as to success. Can the same be said of the moving average convergence/divergence histogram (MACDH), the oscillator component of which should be of some utility in understanding and anticipating the price moves in sugar? As I have written elsewhere, under certain circumstances, extremely high MACDH levels can be powerful "tells" or indicators of higher prices down the road (see "Symmetrical Triangles And The MACDH," Working Money). In the case of sugar futures, the MACDH spike in June 2000 (Figure 2) was its highest level in some time. While it is true that this spike took place as sugar was in a powerful rally from four cents to more than 11 cents, higher prices — such as the 12-cent price sugar futures fetched in December 1997, for example — in and of themselves have not necessarily led to extreme readings in the MACDH. This was the first indication that sugar prices, regarded on a weekly scale, might have bottomed the previous spring (the 1999 low) and might be embarking upon a new bull market. This fact was underscored by the failure of the bear market in sugar prices — a bear market that began late in 2000 and ended in the spring of 2002 — to take sugar prices below the 2000 lows (again, basis continuous futures).
Figure 2: The exceptionally high level in the MACDH reached during sugar's advance in 2000 was a hint that a bottom might have been established with the previous year's lows.
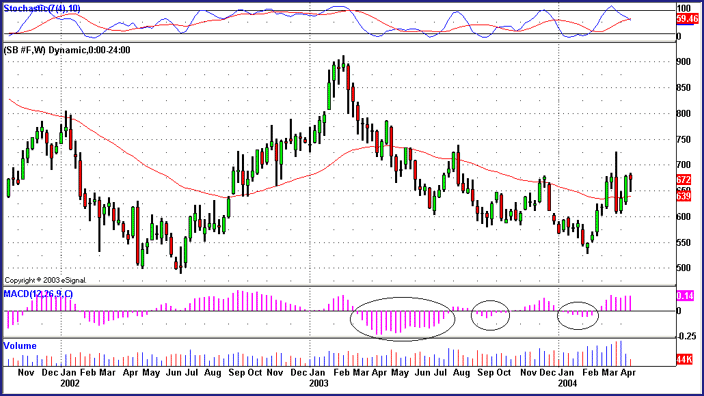
Something similar, though on a smaller scale, took place in the smaller bull market and correction from the spring of 2002 until the spring of 2004. With higher MACDH values than the market had seen since the spring 2000 spike, sugar roared upward again in 2002, climbing from a low of about five cents per pound to a high just north of nine cents by autumn. A correction followed shortly afterward. Like the previously mentioned correction in 2001, sugar's 2003 correction retraced a large percentage of the previous bull market — yet not all of it. And while the correction also featured particularly deep MACDH troughs, those troughs were largely comparable to the peaks of the bull period that preceded them. Nevertheless, those deep MACDH troughs did accurately augur lower prices for sugar futures. Of late, however, the MACDH troughs in sugar futures have become noticeably shallower (Figure 3), while the peaks in the MACD have grown taller and taller with each subsequent rally. This is an especially important action as sugar prices rise up to challenge their 50-week EMA and, if the bulls are fortunate, find support on top of that longer-term moving average. It should be noted that the 2003 correction saw the 50-week EMA act as effective resistance to at least two rallies.
Figure 3: As the MACDH troughs became progressively shallower, it became more likely that the bear market of 2003 might be ending.
Moving in to a daily look at sugar futures, our attention should soon be drawn to yet another MACDH spike — a pair of spikes, actually — in February and March 2004. Again, these spikes dwarf anything on the daily chart going back until January 2003 (when sugar was making an intermediate-term peak). This is another sign of higher prices down the road — and further confirmation that, whatever correction takes place in the near term, higher sugar prices will likely appear in the intermediate- and long-term time frames. The deep MACDH troughs in late March may indicate that the sharp correction in March that followed the sharp rally in February is not quite over, and that some sideways to lower movement may be necessary before the correction is completely through.
An Elliott wave interpretationI continue to rely upon Elliott wave methodology to help provide a context in which to understand and locate the other technical tools I use to analyze price action. As Market Wizard Paul Tudor Jones once alluded in an interview, Elliott wave analysis helps set up sizable risk/reward scenarios, in no small part because of the combination of if/then logic and an understanding of price behavior that allows Elliotticians to disagree about the degree or type of a given wave under consideration, but to have a fair degree of unanimity as to direction. Often, in a trading context, this is all that a savvy market player needs of Elliott wave. The similarity in pattern between the 1999-2000 bull market in sugar and the 2002 bull market in sugar (as well as the similarity between the 2001 and 2003 bear markets in sugar) is an example, I believe, of the fractal nature of wave patterns. By fractal, I mean that each pattern is replicated (albeit not without some variation or even alternation) on a scale one degree larger and one degree smaller. This fractal aspect is among the key characteristics in Elliott wave analysis, and it is helpful in understanding things such as subwaves, which often initially complicate a larger wave count. Here, it appears as if sugar may be on the brink of what Elliotticians refer to as a "third of a third" — or a third wave inside a third wave. Such a wave would be particularly powerful and enduring, filled with gaps, strong up days, and positive intraday divergences. This is because third waves are considered to be the strongest of the five-wave sequence in Elliott wave theory. Lest you think I am exaggerating, here is what Elliotticians Robert Prechter and A.J. Frost wrote about third waves in their book, Elliott Wave Principle:
Third waves are wonders to behold. They are strong and broad, and the trend at this point is unmistakable. Increasingly favorable fundamentals enter the picture as confidence returns. Third waves usually generate the greatest volume and price movement and are most often the extended wave in a series. It follows, of course, that the third wave of a third wave, and so on, will be the most volatile point of strength in any wave sequence.
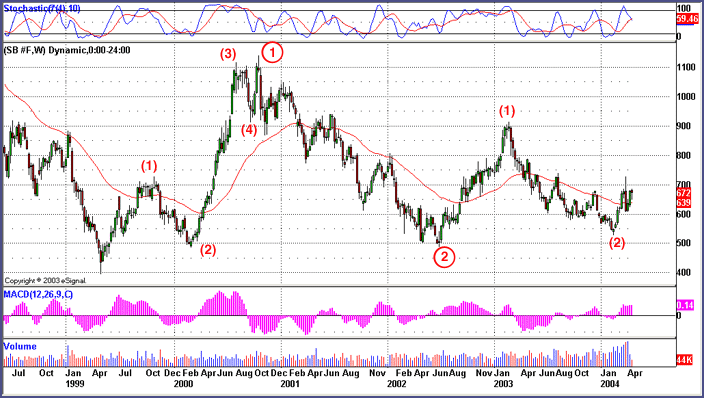
Let's retrace sugar's steps to this point, a point that could represent a major launching pad for these futures (Figure 4). Looking at the weekly chart, it appears that sugar bottomed early in 1999 near four cents. The five-wave sequence that followed saw sugar make a high of 11.40 cents in the autumn of 2000. This five-wave sequence represents a primary wave 1. The correction from late 2000 into 2002 appears to be a zigzag type of correction going into a primary wave 2 low near five cents in the summer of 2002. The advance from this low is, I believe, of one degree smaller — call it an intermediate wave (1) — which topped out near nine cents per pound. The correction following this intermediate wave (1) took prices to a low of approximately 5.3 cents in an intermediate wave (2) low in mid-February 2004.
Figure 4: An Elliott wave interpretation of what may be the first stages of a secular bull market in sugar.
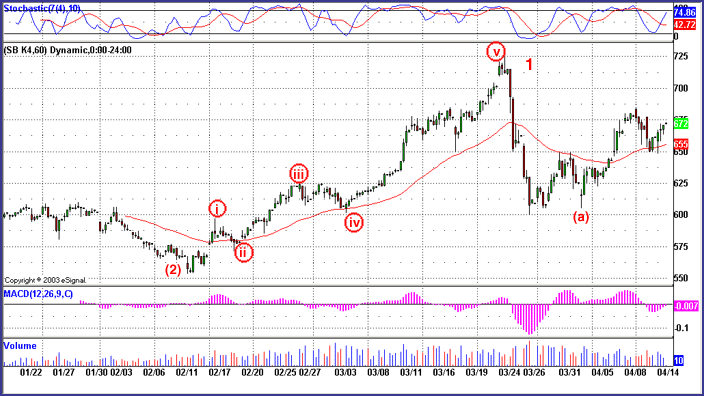
In fact, looking even closer at the charts of sugar, there is an argument that prices are nearing a third of a third of a third. How so? Consider the rally from the primary wave 2 low in February 2004. The initial move up from 5.3 cents to 7.3 cents is quite likely the first up wave of the intermediate wave (3). As such, the move from 5.3 to 7.3 would formally be considered a minor wave. Since the 7.3 peak, prices have reversed in a mild correction that — if its retracement is relatively slight — should form a minor wave 2 low. Following such a low would of course be a third wave rally of the minor degree (a rally from minor wave 2 lows near six cents per pound, basis May futures). Thus, we could have in short order a minor wave 3 inside an intermediate wave (3) inside a primary wave 3.
Figure 5: This hourly chart of May sugar suggests more correction work in a second wave before the bull market resumes.
Can any upside projections of this hypothesized bull market in sugar be made at this time? The only completed projection available at this point is the one based on the primary wave 1 bull market. Here, based on the amplitude of the intermediate (1) and (3) waves, a projection of an intermediate (5) top between 12.6 and 15.6. Given what appears to be an intermediate (5) top at 11.4, this projection overshot by a few cents (as bad as four cents, as tolerably as one cent). What this says about future projections remains to be seen (the methodology here is one I have used frequently and is derived from Robert Fischer's work in his book, Fibonacci Applications And Strategies For Traders). Because there are no completed third waves at the primary, intermediate, or minor level since the one in primary wave 1, we can only use first waves to postulate what should be the low end of projection ranges going forward. Using this data to sketch out some possible future levels for sugar, we get a low-end projection of the minor wave 5/intermediate wave (3) at 10.5 cents. As a low end or minimum projection for intermediate wave (5), we get 15.8 cents. And as a low-end projection for primary wave 5, which would complete the largest five-wave sequence discussed here, a sequence that began with the spring 1999 lows at four cents, we get a minimum upside of 23.4 cents. But any way you take it, if this bullish analysis of sugar is essentially correct, there will be plenty of bullish sweetness to go around.
David Penn may be reached at DPenn@Traders.com
Suggested readingElder, Alexander [1993]. Trading For A Living, John Wiley & Sons.Fischer, Robert [1993]. Fibonacci Applications And Strategies For Traders, John Wiley & Sons. Hannah, A.C., and Donald Spence [1996]. The International Sugar Trade, John Wiley & Sons. Hirai, George T. [1980]. "Sugar And Its Shifting Role In The World Economy," 1980 Commodity Year Book, Commodity Research Bureau. Murphy, John [1996]. The Visual Investor, John Wiley & Sons. Penn, David [2004]. "Symmetrical Triangles And The MACDH," Working Money: March. Prechter, Robert, and A.J. Frost [1978]. Elliott Wave Principle, New Classics. Pruitt, George, John Hill, and Lundy Hill [2000]. The Ultimate Trading Guide, John Wiley & Sons. Charts courtesy eSignal
Current and past articles from Working Money, The Investors' Magazine, can be found at Working-Money.com. |
Technical Writer for Technical Analysis of STOCKS & COMMODITIES magazine, Working-Money.com, and Traders.com Advantage.
| Title: | Traders.com Technical Writer |
| Company: | Technical Analysis, Inc. |
| Address: | 4757 California Avenue SW |
| Seattle, WA 98116 | |
| Phone # for sales: | 206 938 0570 |
| Fax: | 206 938 1307 |
| Website: | www.traders.com |
| E-mail address: | DPenn@traders.com |
Traders' Resource Links | |
| Charting the Stock Market: The Wyckoff Method -- Books | |
| Working-Money.com -- Online Trading Services | |
| Traders.com Advantage -- Online Trading Services | |
| Technical Analysis of Stocks & Commodities -- Publications and Newsletters | |
| Working Money, at Working-Money.com -- Publications and Newsletters | |
| Traders.com Advantage -- Publications and Newsletters | |
| Professional Traders Starter Kit -- Software | |
PRINT THIS ARTICLE

Request Information From Our Sponsors
- StockCharts.com, Inc.
- Candle Patterns
- Candlestick Charting Explained
- Intermarket Technical Analysis
- John Murphy on Chart Analysis
- John Murphy's Chart Pattern Recognition
- John Murphy's Market Message
- MurphyExplainsMarketAnalysis-Intermarket Analysis
- MurphyExplainsMarketAnalysis-Visual Analysis
- StockCharts.com
- Technical Analysis of the Financial Markets
- The Visual Investor
- VectorVest, Inc.
- Executive Premier Workshop
- One-Day Options Course
- OptionsPro
- Retirement Income Workshop
- Sure-Fire Trading Systems (VectorVest, Inc.)
- Trading as a Business Workshop
- VectorVest 7 EOD
- VectorVest 7 RealTime/IntraDay
- VectorVest AutoTester
- VectorVest Educational Services
- VectorVest OnLine
- VectorVest Options Analyzer
- VectorVest ProGraphics v6.0
- VectorVest ProTrader 7
- VectorVest RealTime Derby Tool
- VectorVest Simulator
- VectorVest Variator
- VectorVest Watchdog

