HOT TOPICS LIST
- Strategies
- Stocks
- Buy
- Investing
- Brokers
- Psychology
- Interviews
- Accumulate
- Sell
- Hold
- Spotlight
- Websites
- Candlestick Corner
- Gold & Metals
- Options Trading
LIST OF TOPICS
Topping And The Energy Complex
06/30/04 04:30:55 PM PSTby David Penn
Recent price trends in crude oil, unleaded gasoline, and heating oil suggest an opportunity to review these techniques for anticipating market tops.
| In spite of all advice to the contrary, traders and investors find top- and bottom-picking irresistible. This is not without good reason; the rewards are great for those talented, clever, or merely fortunate enough to buy within a tick of the lows or to sell right at the highs. Even more impressive is the ability to reverse positions, to take advantage not only of the last few moments of a trend, but also to capitalize on its inevitable reversal. How fundamentally oriented traders and investors accomplish this feat will forever be a mystery to me. But technical traders have a number of tools at their disposal — tools that are quite valuable in determining, if not when a specific top or bottom has been established, then at least when the balance of risks is beginning to shift against the established trend. Here, we'll look at three different techniques for spotting potential market tops. The examples will all be from the energy complex — crude oil, natural gas, unleaded gasoline, and heating oil. The energy complex is one that has enjoyed a major bull market over the last few months. Unfortunately, this bull market in energy products has brought with it a major panic that $50 per-barrel crude oil and $5 per-gallon gasoline prices are right around the corner. Politicians have called for the United States to unleash oil from its petroleum reserve. The President has used the opportunity of relatively high energy prices to reinvigorate his energy bill. And no one can fade the role of geopolitical concerns in adding an expensive "risk premium" to the price of crude . . .
Going negative with divergencesOne of the most common techniques for spotting tops in markets is negative divergence. This concept refers to the relationship between price action and an indicator such as momentum, the relative strength index (RSI), rate of change, stochastics, or any host of other common or custom-made oscillators. Writing about divergences, author and technical analyst John Murphy notes that:
There's a second element in oscillator analysis that is extremely valuable. Not only do oscillators help us determine when a market is overbought or oversold, but they also warn us in advance when a divergence is building up in a stock. Divergences usually warn of an impending trend reversal . . . we study two lines that usually trend in the same direction. When they start to diverge from one another, the analyst begins to suspect that the trend is losing momentum. Oscillators are especially helpful for this purpose.
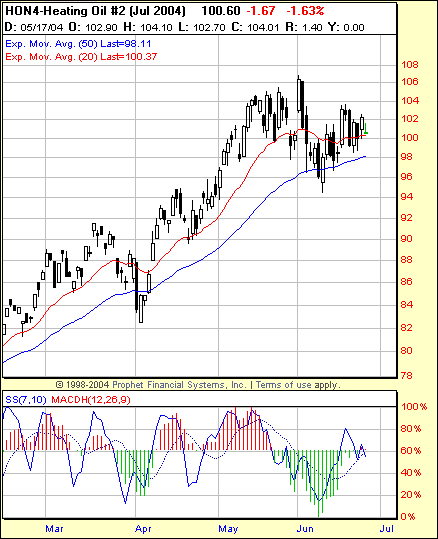
How can a divergence actually be spotted? To put it succinctly, when prices move to make a high, then a higher high, the technician looks to see if the oscillator also followed a high with a higher high. If the oscillator has not, if instead the oscillator follows the high with a lower high, then the technician will note that price action and the oscillator have diverged. In this case, because the market seems to be moving higher while the oscillator seems to be moving lower, the divergence would be referred to as a negative divergence. Figure 1, a chart of July heating oil (HON4), shows an example of a negative divergence in action.
Figure 1: A negative divergence between July heating oil and the 7,10 stochastic warned that a top was likely to be near.
Note how as the bull market in heating oil progressed into May 2004, the stochastic oscillator began marking a series of lower highs. At the same time that the stochastic was marking lower highs, the price for July heating oil was marking higher highs. This is a classic example of a negative divergence between an indicator and price action. At this point, a trader would choose whatever short entry signal he or she preferred. Some traders might wait for a moving average crossover, while others might want to wait for prices to take out the initial post-peak low near 9500. Any number of techniques might be used to take advantage of a potential top. While not an "all clear!" signal for shorts, a negative divergence nevertheless indicates that the balance of risk has shifted against the bulls and in favor of the bears.
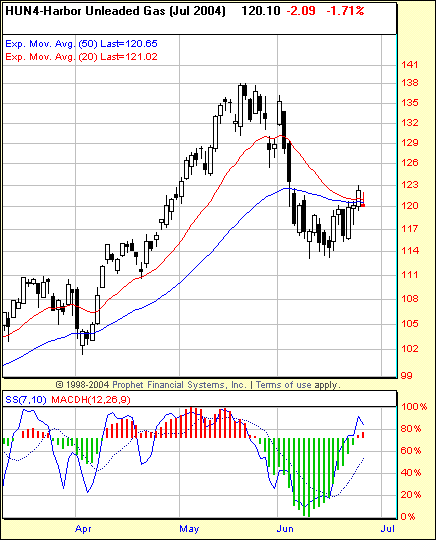
Turtles, 2Bs, and false breakoutsIf the negative divergence is the stealthy way of taking advantage of a trend that is topping, then fading breakouts (hoping they will prove to be false breakouts) is more the equivalent of the 1,500-pound bomb. Techniques for fading breakouts go by a number of names: "Turtle Soup" (Larry Connors), "2B test of top" (Victor Sperandeo), and no doubt plenty of others I've not yet heard of. But the idea behind these techniques is essentially the same: not all breakouts are true breakouts, and if a breakout does not show immediate follow-through to the upside, then there is a "speculator's chance" that the breakout is false and should be faded. Not unlike selling a negative divergence, fading a breakout and hoping it will prove to be false takes some courage. After all, breakouts mean new highs, and whole schools of technical analysis strategy have been founded successfully on the notion of pouncing on new highs. Nevertheless, false breakouts are a reality, and when they are the prelude to a top and a reversal in trend, they can be quite profitable indeed. Consider the chart of July unleaded gasoline (HUN4) (Figure 2):
Figure 2: Call it "2B" or "Turtle Soup," but false breakouts are often a sign of bullish exhaustion, as the repeated failure of HUN4 to follow through to the upside in late May suggested.
The false breakout setups all tend to involve prices making a high, then a subsequent higher high (usually after a pullback). What counts is the follow-through after the subsequent higher high. If there is no follow-through, then the trader is given to believe that a false breakout is occurring and that a short position below the low of the higher high is a reliable entry. Looking at Figure 2, we note that July unleaded gasoline made a high in mid-March, which was followed by a pullback over the next few days. Following the pullback, HUN4 rallied to take out the previous, mid-March high. At this point, the trader suspicious of a potentially false breakout would begin looking to see if there was follow-through on the higher high. Once again, prices retreated. And though prices did not initially fall below the low of the higher high day, they also were unable to establish a new high. Five days later, HUN4 broke: first gapping down, then gapping up, before finally succumbing to the correction — approximately nine days after the higher high day.
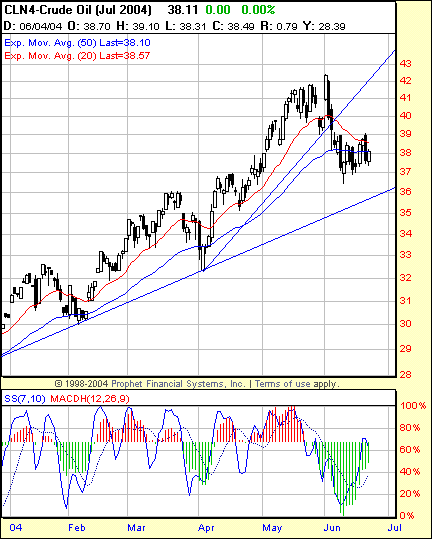
Post-trendline break pivot highsThe third technique incorporates both the 1-2-3 trendline break setup presented by Victor Sperandeo and the relevance of pivot points. I have written about the 1-2-3 trendline break many times before for Working Money and Traders.com Advantage, so I won't rehash what many have already read. Suffice it to say that the 1-2-3 trendline break encourages a trader to rely on three separate events to determine when a top has occurred and a trend reversal is likely. The first event is the trendline break itself. While many technicians advocate that such breaks should be accompanied by outsized volume, a clear-cut break in an up trendline often suffices — especially if the other two criteria develop. The second event in the 1-2-3 trendline break is the attempt by prices to resume the previous, bullish trend. And here is where the pivot point comes in: at some point in this effort to resume the rally, prices will sag or hesitate. When this occurs, traders should look to see whether the "hesitation point" might serve as a potential pivot. Let's look at the example of July crude oil. While CLN4 has not yet broken its major trendline (the trendline that extends back at least to the autumn of 2003), July crude has violated a shorter-term, more intermediate trendline. Thus, we can get a sense of this more minor correction and perhaps even a broader understanding of the larger correction upon which July crude may be embarking (Figure 3).
Figure 3: A break with the two-month trendline suggests a test of the much longer trendline.
The shorter-term trendline in July crude (the two-month line) was broken very early in June at about 39.5, and crude kept falling until it hit about 36.50. From there, CLN4 rallied back (the "second event" in the 1-2-3 trendline break setup) to as high as 39. Right now, a trader could reasonably look at the 39 level as a potential pivot, especially as prices retreated from that level (note also how the stochastic is hooking sharply downward). While it is entirely possible that July crude will again reverse and move above 39, this level serves as a reasonable resistance/stop-loss point for a trader who wanted to take a short position in crude. There is, of course, a third event in the 1-2-3 trendline break setup, the event that actually marks the change in trend after the top appears to be established based on the first event and the failure of the second event to set a new high. The third event takes place when prices again move downward and take out the post-break low (here at about 36.5). In the case of July crude and its two-month trendline break, this has not yet happened, but it would be the next thing a trader in crude oil would be looking for.
Finishing at the topThere are other ways of determining when the risk equation tilts away from the bulls and toward the bears as a market soars toward a potential top. One of my favorite approaches is the MACDH trough, about which I have written for Working Money (see my "Post-Breakdown MACDH Extremes" from May 19, 2004). The MACDH trough actually uses the size of the initial post-peak decline to spot potential tops and, like these other approaches, works well on a variety of time frames and periodicities. Even a trader whose trend-following method usually has him or her positioned "wrong" at market turns can benefit from top-picking strategies. Such strategies can be part of a money management program that seeks to reduce exposure to a given market when the odds of a top — as measured by any one or a combination of these methods — grow uncomfortably large. Investors (who might not ever go short or invest in short funds) can use these techniques to decide how much and at what rate to contribute to an IRA or 401(K) plan so as to maximize their contributions by buying cheap and moving to cash when the market is positioned precariously. However these techniques are employed, as a standalone top-picking approach or as part of an overall understanding and monitoring strategy for the markets as a whole, just about every trader and investor can benefit from learning how — like bull markets — they can find themselves finishing at the top.
David Penn may be reached at DPenn@Traders.com.
Suggested readingConnors, Laurence A., and Linda Bradford Raschke [1995]. Street Smarts, M. Gordon Publishing.Murphy, John J. [1996]. The Visual Investor, John Wiley & Sons. Penn, David [2004]. "Post-Breakdown MACDH Extremes," Working Money: May 19. Sperandeo, Victor [1991]. Trader Vic — Methods Of A Wall Street Master, John Wiley & Sons.
Charts courtesy Prophet Financial Systems
Current and past articles from Working Money, The Investors' Magazine, can be found at Working-Money.com.
|
Technical Writer for Technical Analysis of STOCKS & COMMODITIES magazine, Working-Money.com, and Traders.com Advantage.
| Title: | Traders.com Technical Writer |
| Company: | Technical Analysis, Inc. |
| Address: | 4757 California Avenue SW |
| Seattle, WA 98116 | |
| Phone # for sales: | 206 938 0570 |
| Fax: | 206 938 1307 |
| Website: | www.traders.com |
| E-mail address: | DPenn@traders.com |
Traders' Resource Links | |
| Charting the Stock Market: The Wyckoff Method -- Books | |
| Working-Money.com -- Online Trading Services | |
| Traders.com Advantage -- Online Trading Services | |
| Technical Analysis of Stocks & Commodities -- Publications and Newsletters | |
| Working Money, at Working-Money.com -- Publications and Newsletters | |
| Traders.com Advantage -- Publications and Newsletters | |
| Professional Traders Starter Kit -- Software | |
PRINT THIS ARTICLE

Request Information From Our Sponsors
- StockCharts.com, Inc.
- Candle Patterns
- Candlestick Charting Explained
- Intermarket Technical Analysis
- John Murphy on Chart Analysis
- John Murphy's Chart Pattern Recognition
- John Murphy's Market Message
- MurphyExplainsMarketAnalysis-Intermarket Analysis
- MurphyExplainsMarketAnalysis-Visual Analysis
- StockCharts.com
- Technical Analysis of the Financial Markets
- The Visual Investor
- VectorVest, Inc.
- Executive Premier Workshop
- One-Day Options Course
- OptionsPro
- Retirement Income Workshop
- Sure-Fire Trading Systems (VectorVest, Inc.)
- Trading as a Business Workshop
- VectorVest 7 EOD
- VectorVest 7 RealTime/IntraDay
- VectorVest AutoTester
- VectorVest Educational Services
- VectorVest OnLine
- VectorVest Options Analyzer
- VectorVest ProGraphics v6.0
- VectorVest ProTrader 7
- VectorVest RealTime Derby Tool
- VectorVest Simulator
- VectorVest Variator
- VectorVest Watchdog


