HOT TOPICS LIST
- Strategies
- Stocks
- Buy
- Investing
- Brokers
- Psychology
- Interviews
- Accumulate
- Sell
- Hold
- Spotlight
- Websites
- Candlestick Corner
- Gold & Metals
- Options Trading
LIST OF TOPICS
SECTOR SPOTTING
Crosses, Candlesticks, And Q-Stick
11/19/04 04:11:43 PM PSTby David Penn
Try this three-step methodology for locating trading opportunities.
| I was rereading Steve Nison's Beyond Candlesticks a few days ago and stumbled upon his discussion of moving average crossovers. Specifically, Nison was talking about what Japanese technical analysts have referred to for years as bullish golden crosses and bearish dead crosses. In the chapter titled "How the Japanese Use Moving Averages," Nison writes:
The Japanese use dual moving averages in which they compare short and long-term averages. For example, they will compare the 13-week and 26-week moving averages... if a shorter term moving average crosses over the longer term moving average, it is viewed as a bullish sign. The Japanese call such a crossover a golden cross. A dead cross is a bearish indication that occurs when a short-term moving average crosses under the longer term moving average.
Moving average crossovers, whether deployed on weekly price charts or daily ones, are hardly news to the informed technical analyst these days. Although a variety of combinations of moving averages have been used over the years, the notion of momentum embedded in the use of moving averages of varying durations is consistent regardless of the moving average combinations used. There is a simplicity in moving average crossovers that probably adds to their appeal. When they cross, you trade. However, I suspect that many people who have used moving average crossovers have at least occasionally found them wanting. Just when after the cross should the trade be placed? What if the moving averages haven't crossed yet, but are "sure to" any tick now? Is there a stop-based price target that should be used for entry — or simply buying the open on the first day after the moving average crossover?
From crosses to candlesticksOne partial solution is to use candlesticks to determine just when, in the vicinity of a moving average crossover, the balance of power has shifted from bulls to bears (or vice versa). Candlesticks provide a compelling tool for discovering this shift in strength between bulls and bears. As noted technical analyst Tushar Chande observed in his book, The New Technical Trader:
...The candlestick method of price analysis is mainly a pattern-recognition technique. Hence, it has predictive power, unlike moving averages or oscillators... The range between the open and the close shows the power of bulls or bears. A market has great power or conviction when the open and close are far apart. Conversely, a market lacks power or conviction when the open and close are not far apart.
How can candlesticks be used effectively in conjunction with moving average crossovers? Essentially, once a moving average crossover occurs, a trader would begin looking for confirmation to the upside or downside in the form of a bullish or bearish candlestick. One benefit of this approach is that, in addition to simply using multiple technical tools to confirm a bullish or bearish technical development, it is often easier to analyze a candlestick when a trader knows exactly what he or she is looking for. In other words, when a shorter-term moving average crosses above a longer-term moving average, all the trader needs to do is call up his or her mental list (or photocopied cheat sheet) of bullish candlesticks. It should not be necessary for that confirming bullish candlestick to appear after the moving average cross. That confirming candlestick could — as some of the examples show — appear a few days before the actual moving average crossover. Recall that candlesticks do nothing so well as provide a graphic representation of fear and greed in the marketplace. All that confirming candlestick does is provide evidence not only that the trend is changing (by dint of the moving average crossover), but that traders have started to realize that the trend is changing (by dint of the candlestick).
Q helps mark the spotBefore looking at some examples of the moving average crossover/candlestick combination, let me add one other technical indicator: Tushar Chande's Q-stick. Introduced over a decade ago, Chande's Q-stick provides a quantitative interpretation of candlestick properties, including that most vital of candlestick properties — the relative strength between the bulls and the bears. As Chande wrote:
We have noted that the range between the open and the close is the most important element of candlestick analysis. The difference, close minus open, is a measure of intraday (or intraperiod) momentum. We have quantified this range to develop a trend-following indicator. This indicator, called Q-stick, can be defined as the moving average of the intraday momentum.
Chande (and his coauthor, Stanley Kroll) suggest an eight-period moving average and, while other period lengths may be worth experimenting with, Chande's original prescription should suffice for most uses, including this one. How is this original prescription then best filled? Chande offers two approaches. The first — and the one that will be used here — involves comparing the Q-stick to price action in an attempt to spot divergences. Another method is to "smooth" the Q-stick with another moving average and to use crossovers between the Q-stick and its moving average to provide signals. Still another approach involves spotting instances in which the Q-stick oscillator crosses above or below a zero line. But because the moving average crossover and the confirming candlestick already provide a signal, the use of the Q-stick that is the most interest here is the first one mentioned: spotting divergences that will support the case for a reversal in trend. By looking for instances in which there has been a moving average crossover and a confirming candlestick first, a positive or negative divergence between price action and the Q-stick help traders spot scenarios that have the greatest likelihood of a reversal. Although a tertiary indicator, Q-stick and its positive/negative divergences will help designate certain environments as more conducive to a breakout or breakdown than others.
From sector to stockLet's take a look at this technical trio of moving average crosses, Japanese candlesticks, and the Q-stick. For the moving average crosses, I'll use 13- and 26-period exponential moving averages (EMAs). In addition, to add just another wrinkle, I'll use this approach to work from a top-down analysis of the market (starting with sectors) to get to a specific examination of individual stocks. One watchlist I keep is of the eight largest HOLDRs. While some traders have no problem with voluminous watchlists, I find it much easier to stay focused by limiting the number of sectors and stocks I look at. Sure, every time I read about a relatively lesser-known stock rocketing up 3% in a day, or some second-tier name dropping by five points in a session, I curse myself for not being one of those technicians who looks at hundreds of stocks each night. But as a favorite, famous movie actor once put it, "A man's gotta know his limitations." And using the HOLDRs as my proxy for the main market sectors fits my limitations just fine. The HOLDRs I look at are Internets (HHH), semiconductors (SMH), retail (RTH), regional banks (RKH), biotechnology (BBH), oil service (OIH), telecommunications (TTH), and pharmaceuticals (PPH). While BBH is currently showing how effective this cross/candlestick/Q-stick combination can be, I'll skip the biotechs because I've written comprehensively about them recently ("Dr. Reversal And Mr. Support," Working Money, October 13, 2004).
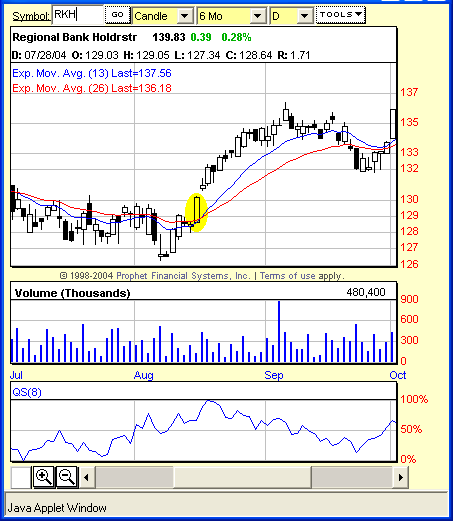
Figure 1: A move higher in the regional banking HOLDRS (RKH) was anticipated by the running positive Q-stick divergence, a golden cross with the 13- and 26-day moving averages, and a bullish candlestick.
Let's start with the early days of the August rally. Here, there was a 13/26-day EMA cross in the regional bank HOLDRs (RKH) near the middle of August. Because financials are often among the first sectors to lead new bull moves, the bullish cross (or golden cross per the Japanese) in RKH was worth noting because of both the bullish implications for banking stocks as well as the potentially bullish implication for stocks in general. We also note that RKH was experiencing a running positive divergence with its Q-stick (the positive divergence referring to consecutively lower lows in price being matched by consecutively higher lows in the oscillator). From here, all we are looking for is a bullish candlestick in the vicinity. I would argue that the most bullish candlestick was the one immediately preceding the golden cross. Again, the confirming candlestick need not appear after the cross; it simply must "accompany" the cross.
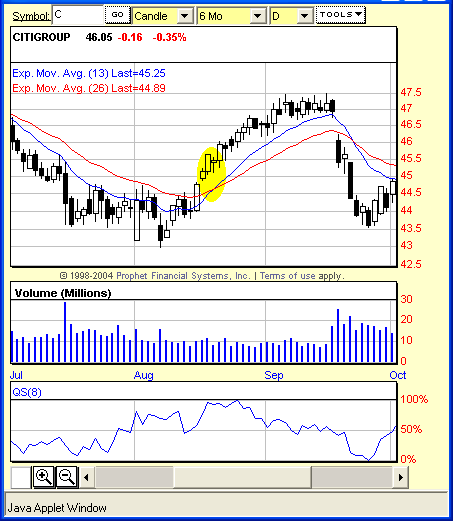
Figure 2: Among the banking/financial stocks, Citigroup showed bullish signals that were remarkably similar to those seen in RKH.
Given this confirmation of a likely rally in RKH, I went looking for financial stocks that also seemed to be moving higher based on the cross/candlestick criteria. While there were a number of financial stocks that appeared to be moving up, the criteria here helped select a few like Citigroup (C), J.P. Morgan (JPM), and Keycorp (KEY) that had golden crosses and confirming candlesticks. Citigroup even featured a positive Q-stick divergence.
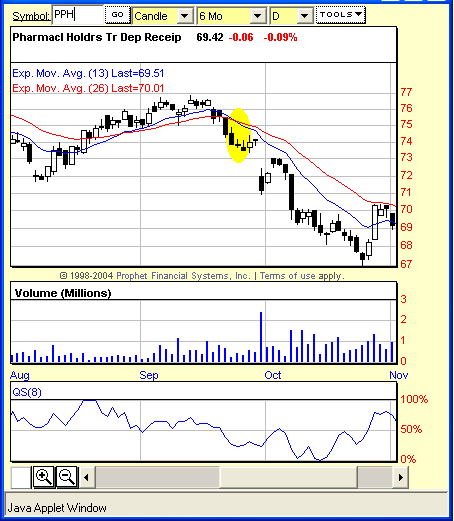
Figure 3: The collapse in the pharmaceutical HOLDRs (PPH) arrived at the end of a running negative Q-stick divergence. Note how the dead cross developed in the midst of a number of bearish candlesticks.
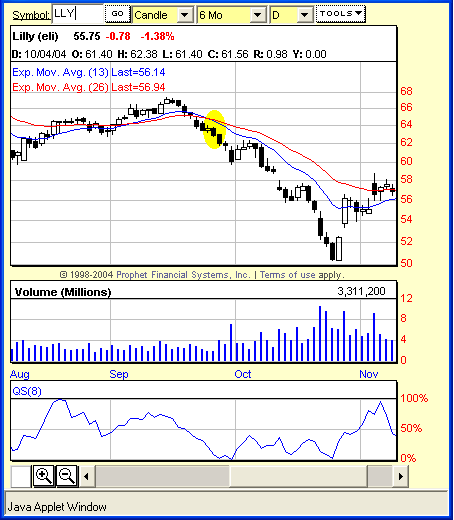
Let's look at an example to the downside. Pharmaceutical stocks have been in the doghouse for the past several weeks. The pharmaceutical HOLDRs featured a bearish (or "dead") cross on September 24. This dead cross developed both at the end of a running negative Q-stick divergence (by running, I'm referring to a series of small but regular divergences, as opposed to a single, two-point divergence), and in the neighborhood of clearly bearish candlesticks on September 22, 23, and 27. From here, we switch to individual stocks in the pharmaceutical group. Among those stocks that had recent or same-day dead crosses, pharmaceutical stocks like AstraZeneca (AZN), Eli Lilly (LLY), Pfizer (PFE), and Schering-Plough (SGP) appeared as some of the better short candidates. Among these, the negative Q-stick divergence that appeared in LLY made that stock appear to be among those most likely to move lower convincingly.
Figure 4: While there was plenty of destruction to go around, Eli Lilly's price action was very similar to that of PPH with regard to the dead cross, the negative Q-stick divergence, and a neighborhood of bearish candlesticks.
QonclusionsOne of the most helpful aspects of using multiple indicators is that some indicators are able to make up for the deficiencies of others. In the case of the crosses/candlesticks/Q-stick triad, the moving average crossover helps determine trend, but lags somewhat. Thus the anticipatory nature of candlesticks and candlestick patterns helps balance out that lagging character of the moving average crossover. The Q-stick plays an even more anticipatory role in making it easy for traders and investors to spot potential tops and bottoms before bearish or bullish candlesticks become clear, and often long before any actual moving average crossover occurs. In fact, some traders may even want to mix up the order or priority of these indicators. Those who like to pick tops and bottoms may use Q-stick divergences as a primary screening tool, with candlesticks and candlestick patterns providing entry targets and moving average crossovers playing a merely confirming role. What is important is that the indicators complement — rather than simply replicate — each other. While this does become increasingly difficult to as the number of indicators climbs higher (after all, the basis of all indicators is still price, volume, and time), a set of three indicators — whether they are the three used here or not — can be an excellent way of splitting the difference between having too many indicators and too few.
David Penn may be reached at DPenn@Traders.com.
Suggested readingChande, Tushar S., and Stanley Kroll [1994]. The New Technical Trader, John Wiley & Sons.Nison, Steve [1994]. Beyond Candlesticks, John Wiley & Sons. Charts courtesy Prophet Financial Systems
Current and past articles from Working Money, The Investor's Magazine, can be found at Working-Money.com. |
Technical Writer for Technical Analysis of STOCKS & COMMODITIES magazine, Working-Money.com, and Traders.com Advantage.
| Title: | Traders.com Technical Writer |
| Company: | Technical Analysis, Inc. |
| Address: | 4757 California Avenue SW |
| Seattle, WA 98116 | |
| Phone # for sales: | 206 938 0570 |
| Fax: | 206 938 1307 |
| Website: | www.traders.com |
| E-mail address: | DPenn@traders.com |
Traders' Resource Links | |
| Charting the Stock Market: The Wyckoff Method -- Books | |
| Working-Money.com -- Online Trading Services | |
| Traders.com Advantage -- Online Trading Services | |
| Technical Analysis of Stocks & Commodities -- Publications and Newsletters | |
| Working Money, at Working-Money.com -- Publications and Newsletters | |
| Traders.com Advantage -- Publications and Newsletters | |
| Professional Traders Starter Kit -- Software | |
PRINT THIS ARTICLE

Request Information From Our Sponsors
- StockCharts.com, Inc.
- Candle Patterns
- Candlestick Charting Explained
- Intermarket Technical Analysis
- John Murphy on Chart Analysis
- John Murphy's Chart Pattern Recognition
- John Murphy's Market Message
- MurphyExplainsMarketAnalysis-Intermarket Analysis
- MurphyExplainsMarketAnalysis-Visual Analysis
- StockCharts.com
- Technical Analysis of the Financial Markets
- The Visual Investor
- VectorVest, Inc.
- Executive Premier Workshop
- One-Day Options Course
- OptionsPro
- Retirement Income Workshop
- Sure-Fire Trading Systems (VectorVest, Inc.)
- Trading as a Business Workshop
- VectorVest 7 EOD
- VectorVest 7 RealTime/IntraDay
- VectorVest AutoTester
- VectorVest Educational Services
- VectorVest OnLine
- VectorVest Options Analyzer
- VectorVest ProGraphics v6.0
- VectorVest ProTrader 7
- VectorVest RealTime Derby Tool
- VectorVest Simulator
- VectorVest Variator
- VectorVest Watchdog


