HOT TOPICS LIST
- Strategies
- Stocks
- Buy
- Investing
- Brokers
- Psychology
- Interviews
- Accumulate
- Sell
- Hold
- Spotlight
- Websites
- Candlestick Corner
- Gold & Metals
- Options Trading
LIST OF TOPICS
TRADER'S NOTEBOOK
A View Of 2004 From The Inside
01/13/05 01:47:24 PM PSTby Matt Blackman
It was another great year for corporate insiders to cash in their company's stock, and they did so in a big way. It is important that the trader understand how insider signals work and under what conditions they generate the best results. Here's our insider perspective on 2004.
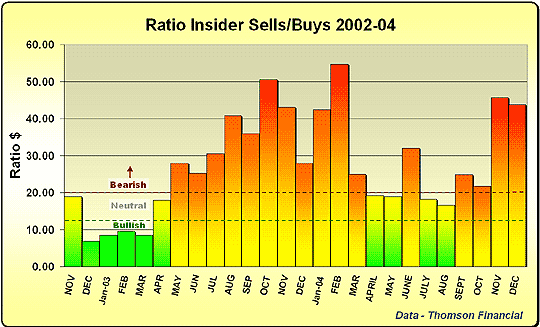
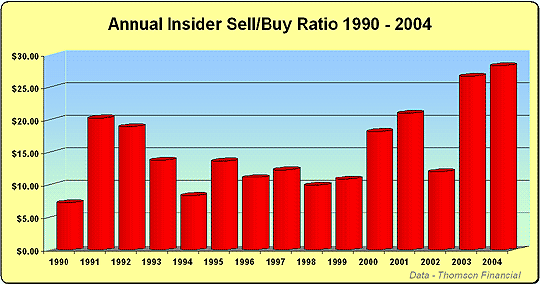
| Insider sales surged 40% between 2003 and 2004, which makes 2004 the second highest year for gross profit taking on record, according to a recent report from the Insider Research Team at Thomson Financial. Sales of corporate insiders' shares surged from $29 billion in 2003 to $41 billion last year (Figure 1). While insider buying increased to $1.45 billion from $1.14 billion in 2003, insider buying in 2004 represented the second lowest level since 1996. The annual sell/buy ratio hit $28.33 worth of shares sold for every dollar purchased, the most bearish measure in any year since the team began keeping records (Figure 2).
Figure 1: The monthly ratio of insider sells to buys from November 2002. Data by Thomson Financial.
On a month-to-month basis, a decrease in insider buying across most industries was observed in December, the most notable of which was technology. The financing sector continued to show the strongest insider-buying activity for the last two months of 2004. On the basis of market capitalization, large-caps and mid-caps experienced large month-to-month declines in buying by corporate insiders from November to December as well. There was also a decrease in selling in the last month of the year in the rest of the market, but this was normal, given the restrictions due to the release of fourth-quarter corporate results in January. Whether taken monthly or annually, the insider sell/buy ratio is considered by Thomson to be the most accurate overall metric of insider activity. Any reading below $12 is consider bullish and above $20 bearish.
Figure 2: Annual average of insider sell/buy ratio. The year 2004 holds the record for the highest ratio of selling to buying at 28.33 to 1 compared to the second-highest ratio value of 26.67 to 1 in 2003. Data by Thomson Financial.
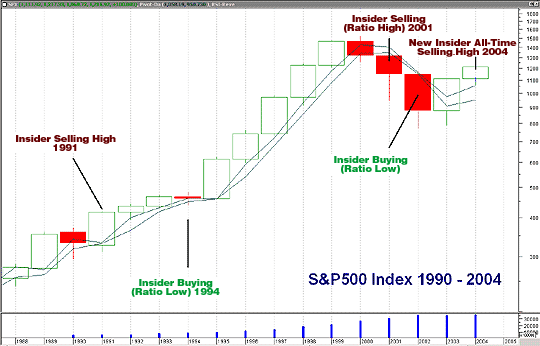
Annual signalsBefore jumping to conclusions on whether this annual increase signals a market top of sorts, however, it is important to put the findings in the proper context. While 2004 registered the highest insider sell/buy ratio in history, we should look at the last times the level of selling exceeded $20. The first time occurred when the ratio jumped from $7.25 in 1990 to $20.26 in 1991. Selling on this signal would have been a big mistake. Insiders were simply taking advantage of market strength to sell shares and lock in profits. As you see from Figure 3, the market barely paused before continuing higher.
Figure 3: Annual chart of the S&P 500 showing highs and lows in the insider sell/buy ratio. The first peak in selling in 1991 would not have been a good signal to follow. Will the most recent annual high in 2004 be the same? Chart provided by MetaStock.com
The next year the bearish threshold was exceeded was in 2001. By this time, however, the market had already dropped substantially so the signal was late. Later in 2003, the ratio hit $26.67, and selling in early January 2004 would not have been a bad move. The market subsequently dropped for the first six months of the year. Since 1990, the first date from which data is available, annual spikes and troughs in the sell/buy ratio have generated a total of six times and signals have been mixed at best. So it stands to reason that it would be premature to draw any conclusions from the 2004 ratio value of more than $28. There isn't enough consistent data.
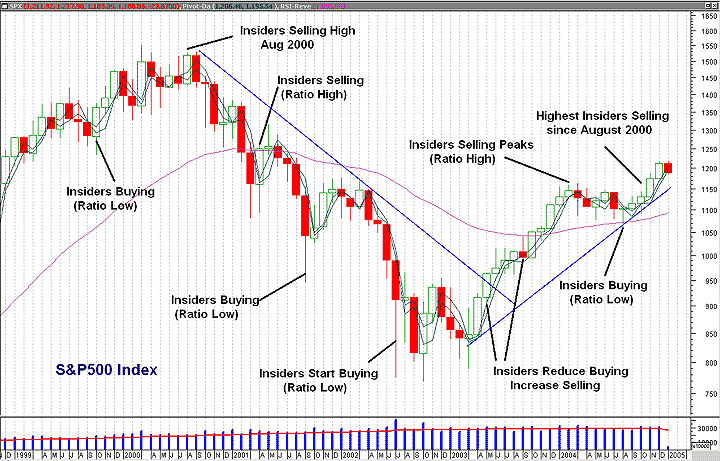
Monthly data: more timely and frequent signalsAs we see from an examination of Figures 1 and 3, monthly insider selling (high ratio values) and buying peaks (low ratio values) seem to be pretty good signals to follow. Historically, insider buying when the market is at lows or following a retracement during a bull market has been the best signal to follow. The same goes for high levels of selling (high ratio value) near a market top or during bear markets. So are we currently near a market top? That monthly insider selling was less in December 2004 than it was in February 2004 suggests we have not yet reached an extreme. We are still in a bull market above the bullish trendline and both 50- and 200-day moving averages on the S&P 500.
Figure 4: Monthly chart of S&P 500 shows peaks and valleys in the insider sell/buy ratio. Chart provided by MetaStock.com
ConclusionsAccurate annual insider activity data has only been available since the late 1980s, and signals are mixed. Even if the signals were consistent, there would be far too little data from which to draw statistically significant conclusions. Based on a study of 17 monthly buy and sell signals between 1990 and 2004, monthly insider buying and selling signals have proven more useful, but it is essential that the trader understand the difference. Corporate insiders sell stock to raise money for a number of reasons and will sell at an appropriate time to lock in profits. Unless selling occurs during a bear market, it does not necessarily warn of a major market top. Taking a cue from spikes in insider selling during a bull market may be of some use in protecting profits, but shorting them is highly risky. Since insiders must shell out hard-earned cash to buy their company's shares, these signals have proven to be the most accurate. Insider buying can be highly profitable at the end of an extended bearish move when the market is showing signs of bottoming. They are excellent signals to follow in a bull market. But even in a bear market, insider buying spikes are useful in covering short positions or playing rallies for the more aggressive trader. As long as the current bull rally remains in effect, the peak in monthly insider selling that occurred in November 2004 may be not a bad signal to be used to take profits or protect capital. Until there is confirmation that the trend is coming to an end, however, using it to short the market must be considered highly risky at best.
Matt Blackman is a technical trader, author, reviewer, keynote speaker and regular contributor to a number of trading publications and investment/trading websites in North America and Europe. He is an affiliate member of the Market Technicians Association and the Canadian Society of Technical Analysts, and is currently enrolled in the Chartered Market Technicians (CMT) program. He can be reached at matt@tradesystemguru.com or trader@goldhaven.com.
SUGGESTED READINGBlackman, Matt [2004]. "Insider Selling Hits Four-Year High," Working Money, December 8. Data by Thomson Financial Current and past articles from Working Money, The Investor's Magazine, can be found at Working-Money.com.
|
Matt Blackman is a full-time technical and financial writer and trader. He produces corporate and financial newsletters, and assists clients in getting published in the mainstream media. He tweets about stocks he is watching at www.twitter.com/RatioTrade Matt has earned the Chartered Market Technician (CMT) designation.
| E-mail address: | indextradermb@gmail.com |
PRINT THIS ARTICLE

|

Request Information From Our Sponsors
- StockCharts.com, Inc.
- Candle Patterns
- Candlestick Charting Explained
- Intermarket Technical Analysis
- John Murphy on Chart Analysis
- John Murphy's Chart Pattern Recognition
- John Murphy's Market Message
- MurphyExplainsMarketAnalysis-Intermarket Analysis
- MurphyExplainsMarketAnalysis-Visual Analysis
- StockCharts.com
- Technical Analysis of the Financial Markets
- The Visual Investor
- VectorVest, Inc.
- Executive Premier Workshop
- One-Day Options Course
- OptionsPro
- Retirement Income Workshop
- Sure-Fire Trading Systems (VectorVest, Inc.)
- Trading as a Business Workshop
- VectorVest 7 EOD
- VectorVest 7 RealTime/IntraDay
- VectorVest AutoTester
- VectorVest Educational Services
- VectorVest OnLine
- VectorVest Options Analyzer
- VectorVest ProGraphics v6.0
- VectorVest ProTrader 7
- VectorVest RealTime Derby Tool
- VectorVest Simulator
- VectorVest Variator
- VectorVest Watchdog


