HOT TOPICS LIST
- Strategies
- Stocks
- Buy
- Investing
- Brokers
- Psychology
- Interviews
- Accumulate
- Sell
- Hold
- Spotlight
- Websites
- Candlestick Corner
- Gold & Metals
- Options Trading
LIST OF TOPICS
DOW THEORY
Confirmation Comeback?
02/02/05 01:24:39 PM PSTby David Penn
Are the transports on the verge of actually making a bearish confirmation?
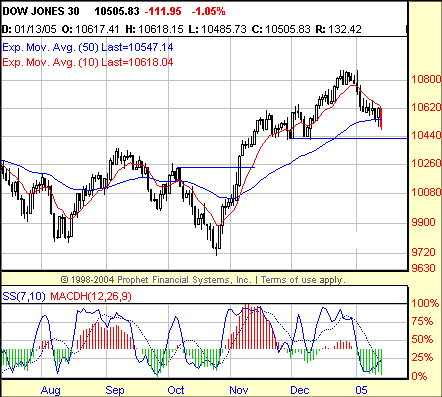
| A few months ago in a Traders.com Advantage article, I underscored the argument for a rising market going into the end of 2004. Of the numerous arguments in favor of higher prices in the stock market, one of the more impressive was the bullish confirmation between the Dow Jones Industrial Average (DJIA) and the Dow Jones Transportation Average (DJTA) that occurred in early November. In fact, to say "early November" is a bit coy — and "bullish confirmation" is almost an understatement. Why so? Because the industrials and transports both bested their October highs on the same day — November 4, two days after the US Presidential election. Having written frequently about confirmations in Dow theory, I don't want to rehash the same old discussion. Suffice it to say that same-day confirmations, while not necessarily any more valid than confirmations that take a few days or even a few weeks to occur, are often strong signals that the trend the confirmations are, well, confirming is a powerful and enduring one. Same-day confirmations were a staple of the bull market in 2003, particularly in the autumn of 2003 when the uptrends were arguably at their strongest. Similarly, same-day confirmations were part of the bear market in 2004 — particularly the bearish confirmation in March, relatively early in that bear market (see my "The Dow Days Of Summer," September 1, 2004, Working-Money.com). So I won't pretend that my attention wasn't seized by the same-day bullish confirmation in the industrials and transports from November 4. From the close of that day, the Dow industrials rallied another 2.3% over the next 30-odd days en route to a closing high more than 500 points (basis November 4) by December 28. Similarly, the Dow transports rallied 4% over the 30 days after the November 4th close, taking on an additional 3% before making its closing high on December 29.
Back to the bear side?The rally since the bullish confirmations on November 4, then, has been real and sustained. Even when both the industrials and transports began moving sideways briefly in mid- to late November, another bullish confirmation signaled continued upside. This bullish confirmation came in the form of both averages simultaneously taking out their November highs on December 1 (again, this is on a closing high basis). In fact, it was this bullish confirmation that powered both averages up to what now stands as the top of the bull market that extends all the way back to the October 2002 lows (see my "Elliott Wave 2005," January 12, 2005, Working-Money.com for more analysis on this cyclical bull market inside a larger secular bear market).
Figure 1: Breaking out to new highs on November 4, the Dow industrials hinted at significantly higher prices going into the end of the year. By late December, the Industrials had gained more than 5% since the post-election breakout.
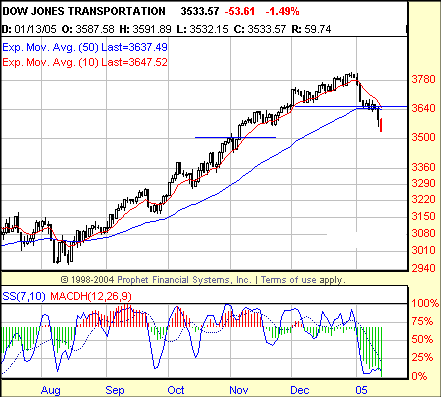
But where does the correction that began early in January 2004 leave the averages? Has it been confirmed by both the industrials and the transports? As it stands, the correction in the Dow transports took out the December 2004 lows back on January 5. The industrials, as of this writing, are still some 150-odd points away from their December 2004 lows. This suggests that the January declines are still best regarded not as a bear market in and of itself, but as a correction within the overall bullish trend (or "trends": there is a bull market from October 2002 still in effect; others may prefer to think of the current advance from the August 2004 lows as its own bull market phase). This is true even if the transports crash down through the November 2004 lows near 3450; in the absence of confirmation by the industrials to the downside, even a decline in the transports that took out the lows of the previous two months would have to be regarded as a "temporary" setback.
Figure 2: The Dow transports and industrials enjoyed a same-day confirmation on November 4. Their separate journeys back down during the January correction so far appear to be more of a follow-the-leader experience.
So what is the Dow theory analysis of the market right now? Including the 100-plus point loss the Dow industrials suffered today in the picture, it seems likely that the industrials will confirm the transports move below the December lows. This bearishness is supported by a number of factors, including a "sell divergence" on monthly charts of the industrials and a move back inside the trend channel that virtually defined the rally in stocks since the August 2004 lows. While I had been cautiously near-term bullish in recent articles ( "Elliott Wave 2005," suggests that the Standard & Poor's 500 could rally as high as 1260 or so and still be consistent with what most would regard as a wildly bearish secular outlook), the industrials' recent close beneath the 50-day exponential moving average (EMA) certainly suggests that the market has more work to do on the downside before resuming its advance.
The averages taken technicallyLooking technically — but with this Dow theory analysis providing the context — both averages are significantly oversold (consider both the 7,10 stochastic and the moving average convergence/divergence histogram [MACDH]). This much is valid for as long as the Dow industrials remain above their 50-day EMA. Based on the MACDH entry method I've discussed both in Working-Money.com and Traders.com Advantage, there is a long opportunity above the early January 2005 range in the industrials at about 10,704.50. Because the transports are currently trading below the 50-day EMA, the MACDH entry method would require a positive stochastic divergence, rather than simply an uptick in the MACDH. That positive stochastic divergence may or may not be such a hurdle for any bounce in the transports. The transports have made sequentially lower lows in price (January 7 and 13), yet the 7,10 stochastic has not yet followed up with sequentially lower lows itself. This could change any day. If the transports continue to falter — particularly with selling days that close near the lows of the day — then it is likely that the stochastic will go ahead and create that sequentially lower low. However, any significant bounce in the very near term will likely force the stochastic to continue with its current "curling" upward. And such a curling is likely to lead to a sequentially higher stochastic low and a bullish, positive divergence in the Dow transports.
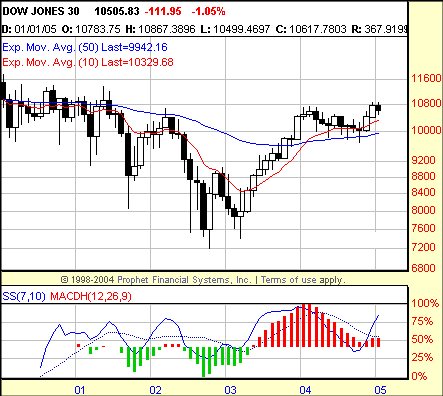
Figure 3: A "monthly sell divergence" between the 7,10 stochastic and price action in the Dow industrial could produce a significant decline if the stochastic in January rolls over to establish a lower stochastic high.
Speaking of divergences, recall that it was a negative stochastic divergence that anticipated the current weakness in the averages. It is also worth noting that both negative divergences have since been confirmed using the process I described in a recent Working-Money.com article, "Confirming Divergences." Nevertheless, the most arresting divergence I've heard of isn't found on daily or weekly charts, but on monthly charts of the S&P 500 and Dow industrials. Credit is due to Linda Bradford Raschke's "Night Owl" series, where I first encountered the monthly sell divergence (see her website at http://www.lbrgroup.com for more information). The oscillator used in the Night Owl series is different from the 7,10 stochastic — though the 7,10 stochastic, as I have noted consistently, is itself a borrowing from the Mind of Raschke (see her book, Street Smarts, coauthored with Laurence A. Connors). In any event, consider the monthly chart of the Dow industrials shown in Figure 3, paying particular attention to the (so far) successively lower stochastic peak above what represents the current August 2004 to present rally in the market. Based on the divergence confirmation method I have mentioned, a close in the Dow industrials below about 10,198.75 or so would have to be considered a major warning of further potential to follow. If such a technical event in the industrials does take place, then be aware of the role such a decline might play in confirming any companion decline in the transports as well.
David Penn may be reached at DPenn@Traders.com.
Suggested readingConnors, Laurence A., and Raschke, Linda Bradford [1995]. Street Smarts, M. Gordon Publishing Co.Penn, David [2005]. "Elliott Wave 2005," Working-Money.com, January 12. __________ [2004]. "Confirming Divergences." Working-Money.com, December 22. __________ [2004]. "Divergences And The Bush Bounce,", Traders.com Advantage, November 9. __________ [2004]. "The Dow Days Of Summer," Working-Money.com, September 1. Current and past articles from Working Money, The Investors' Magazine, can be found at Working-Money.com.
|
Technical Writer for Technical Analysis of STOCKS & COMMODITIES magazine, Working-Money.com, and Traders.com Advantage.
| Title: | Traders.com Technical Writer |
| Company: | Technical Analysis, Inc. |
| Address: | 4757 California Avenue SW |
| Seattle, WA 98116 | |
| Phone # for sales: | 206 938 0570 |
| Fax: | 206 938 1307 |
| Website: | www.traders.com |
| E-mail address: | DPenn@traders.com |
Traders' Resource Links | |
| Charting the Stock Market: The Wyckoff Method -- Books | |
| Working-Money.com -- Online Trading Services | |
| Traders.com Advantage -- Online Trading Services | |
| Technical Analysis of Stocks & Commodities -- Publications and Newsletters | |
| Working Money, at Working-Money.com -- Publications and Newsletters | |
| Traders.com Advantage -- Publications and Newsletters | |
| Professional Traders Starter Kit -- Software | |
PRINT THIS ARTICLE

Request Information From Our Sponsors
- StockCharts.com, Inc.
- Candle Patterns
- Candlestick Charting Explained
- Intermarket Technical Analysis
- John Murphy on Chart Analysis
- John Murphy's Chart Pattern Recognition
- John Murphy's Market Message
- MurphyExplainsMarketAnalysis-Intermarket Analysis
- MurphyExplainsMarketAnalysis-Visual Analysis
- StockCharts.com
- Technical Analysis of the Financial Markets
- The Visual Investor
- VectorVest, Inc.
- Executive Premier Workshop
- One-Day Options Course
- OptionsPro
- Retirement Income Workshop
- Sure-Fire Trading Systems (VectorVest, Inc.)
- Trading as a Business Workshop
- VectorVest 7 EOD
- VectorVest 7 RealTime/IntraDay
- VectorVest AutoTester
- VectorVest Educational Services
- VectorVest OnLine
- VectorVest Options Analyzer
- VectorVest ProGraphics v6.0
- VectorVest ProTrader 7
- VectorVest RealTime Derby Tool
- VectorVest Simulator
- VectorVest Variator
- VectorVest Watchdog


