HOT TOPICS LIST
- Strategies
- Stocks
- Buy
- Investing
- Brokers
- Psychology
- Interviews
- Accumulate
- Sell
- Hold
- Spotlight
- Websites
- Candlestick Corner
- Gold & Metals
- Options Trading
LIST OF TOPICS
THE CHARTIST
Developing Trade Setups
03/29/05 11:02:12 AM PSTby John D. Phillips
The Z-value indicator from the world of statistics can help you find profitable setups.
| In the endless quest for better trading methods, many traders create new indicators to help decide which security to buy or sell. Some of these indicators are mathematical in nature and are based on price or volume characteristics. The world of statistics, for example, has many formulas that can be used in trading if properly adapted. This article explores an application of one such indicator, the Z-value function. When combined with a method that looks for price targets, it makes a handy and logical overbought/oversold indicator, and can steer you toward profitable setups.
Z-VALUE INDICATORBasically, the Z-value indicator from statistics is a measure of how far a given value is from the population mean or average. This distance can be thought of in terms of standard deviation units. For this article, the value is the closing price of a stock. The Z-value function in statistics is calculated as: Z= (Population - Average)/Standard Deviation
For use in trading, it is calculated as: Z=(Closing Price-Moving Averagen)/Standard Deviationn with n being the number of periods used in the calculation: [MetaStock: Z30=(C-Mov(C,30,S))/Stdev(C,30)]
For the purposes of trading in this example, the Z-value is based upon: ·The current closing price of the security
For the purposes of illustration, I used a 30-day period for n.
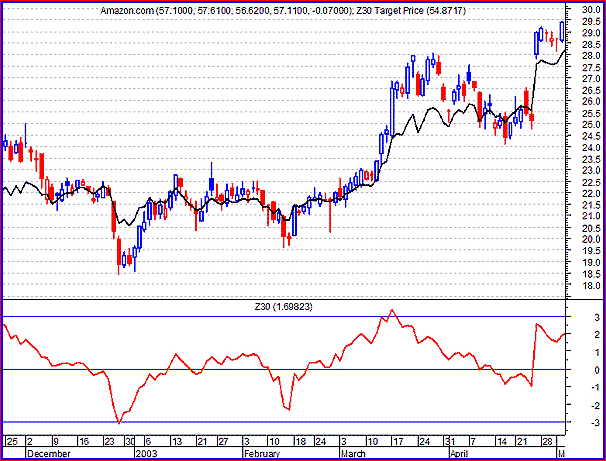
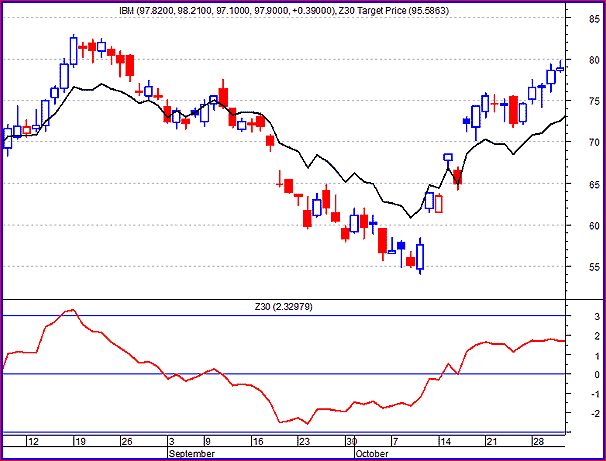
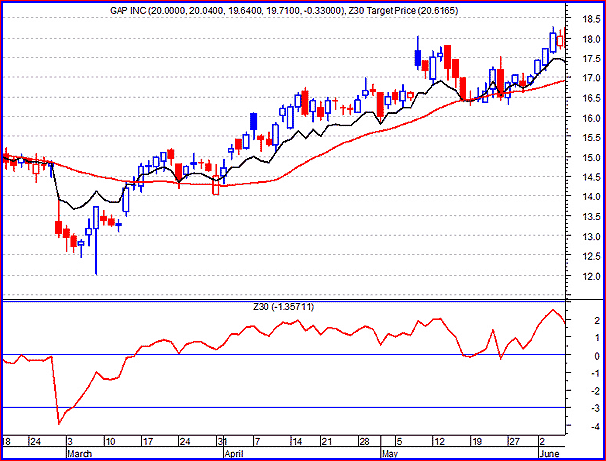
INTERPRETATIONThe Z-value indicator can be used as an overbought/oversold indicator, which can help the trader decide to enter a trade. The trader can purchase or sell the stock or a put or call option on the stock to generate a profit. When combined with price signals and other parameters, it can indicate a profitable setup. Values of +3 (bearish) and -3 (bullish) are used as target values for putting on a trade toward the bias of the signal in this example. I have developed an accompanying indicator called the Zn target price. This is an indicated reversion value for the security and may be employed as an initial price target for making a trade. (If a trend forms after taking the signal it should be followed for further profit). The Zn target price is calculated as: Zn Target Price=Closing Price-(Zn * Standard Deviationn/2)
The Zn target price indicator is essentially the average of the closing price and a moving average, and is a reasonable target for making conservative entry decisions employing options or stocks.
Indicator layout
Overbought situations
Oversold situations
CONCLUSIONThe Z-value indicator, like any other indicator, can also give false or early signals, leading to unprofitable trades. Cautious traders are advised to not follow it blindly. The Z-value indicator alone does not constitute a trading system, but can provide very good setups for making profitable trades. For example, the Z-value can be used with Bollinger Bands as a confirmation tool. By prudent use of money management, risk control, price pattern setups, security or option selection, and trend-following techniques, you should be able to exploit this method profitably. To make the Z-value indicator work for you, experiment with different time frames and trading instruments to suit your own trading style. And above all, have fun while working at it.
John D. Phillips works for a major oil company and is a private trader from Fairbanks, AK. He has an active interest in developing and using technical trading methods.
SUGGESTED READINGValcu, Veronique [2002]. "Z-Score Indicator," Working-Money.com, October 29.
Charts courtesy MetaStock (by Equis).
Current and past articles from Working Money, The Investors' Magazine, can be found at Working-Money.com. |
| E-mail address: | phillips6631@yahoo.com |
PRINT THIS ARTICLE

Request Information From Our Sponsors
- StockCharts.com, Inc.
- Candle Patterns
- Candlestick Charting Explained
- Intermarket Technical Analysis
- John Murphy on Chart Analysis
- John Murphy's Chart Pattern Recognition
- John Murphy's Market Message
- MurphyExplainsMarketAnalysis-Intermarket Analysis
- MurphyExplainsMarketAnalysis-Visual Analysis
- StockCharts.com
- Technical Analysis of the Financial Markets
- The Visual Investor
- VectorVest, Inc.
- Executive Premier Workshop
- One-Day Options Course
- OptionsPro
- Retirement Income Workshop
- Sure-Fire Trading Systems (VectorVest, Inc.)
- Trading as a Business Workshop
- VectorVest 7 EOD
- VectorVest 7 RealTime/IntraDay
- VectorVest AutoTester
- VectorVest Educational Services
- VectorVest OnLine
- VectorVest Options Analyzer
- VectorVest ProGraphics v6.0
- VectorVest ProTrader 7
- VectorVest RealTime Derby Tool
- VectorVest Simulator
- VectorVest Variator
- VectorVest Watchdog


