HOT TOPICS LIST
- Strategies
- Stocks
- Buy
- Investing
- Brokers
- Psychology
- Interviews
- Accumulate
- Sell
- Hold
- Spotlight
- Websites
- Candlestick Corner
- Gold & Metals
- Options Trading
LIST OF TOPICS
INTERMARKET ANALYSIS
Bond. Long Bond.
06/07/05 11:17:44 AM PSTby David Penn
Is it "rational exuberance" that's driving long-term interest rates lower? Or something more ominous?
| "A picture of rational exuberance?" asked Rick Ackerman of Rick's Picks by way of the caption placed on a chart of the most recent move in the bull market in US Treasuries. In the immediate term, Ackerman pointed to a convergence of factors — evidence of modest manufacturing growth with an absence of inflation — that may have acted as catalysts in both the stock and bond camps. "Traders of both stocks and bonds took the news and ran with it early in the session," Ackerman notes. "Both seem to have inferred that it will all but clinch a pause, at least, in the Fed's tightening campaign, which since last June has pushed the fed-funds rate from 1% to 3%." If there is a chalk play in the financial world these days, then that bet seems clearly on the side of those who believe that June 2005 will mark some sort of beginning of the end in the Federal Reserve's campaign to "normalize" short-term interest rates. This sense was echoed throughout the financial media. Quoted in TheStreet.com, one economist announced that the "best of both worlds came in for the financial markets," and that the opportunity for a cease-fire in the Fed's war on inflation was great. So here we are living in paradise, right? A Bloomberg article headlined "US bond forecasters, wrong on yields in 2004, blow it again" seems barely capable of containing a sense of "gotcha!" You see, the poor economists, unlike the clever institutional fixed-income money manager quoted in the piece, "are working from the rulebook." That rulebook suggests that economic growth late in the business cycle is synonymous with higher inflation. And higher inflation means higher interest rates. The contents of that rulebook should be no secret to Working Money readers insofar as I've referred to it at least twice in the past year (see my "The '94 Rules," 4/28/04, and, more recently, "Weakness In Strength," 6/1/05). BOND MARKET BAROMETERS Still yet another application of intermarket analysis involves examining fundamental and economic events through the lens of a technical analysis of the underlying elements that play a role in those events. For example, if a certain explanation calls for higher inflation, then that higher inflation should be manifested in the charts of the dollar, gold, perhaps oil, and long-term interest rates. If those technicals aren't present, then the call for higher inflation needs to be questioned insofar as it remains unsupported by the evidence of the price charts.
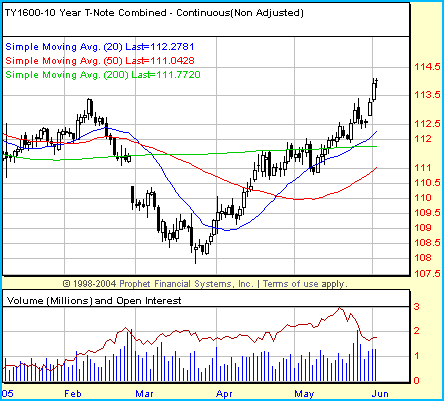
Figure 1: Recent moves in the 10-year note have pulled the 20-day moving average above the 200-day MA. Will the 50-day MA (in red) follow suit?
This latter kind of analysis could prove especially helpful in trying to understand the direction of long-term interest rates as well as the factors that have been driving them lower in recent months. The technical case for higher bond prices — and lower bond yields — remains solid in the immediate term, but understanding what mileposts still exist on the long rates' ride lower should help traders, speculators, and investors more accurately describe the sort of financial and economic environment we will see and what can be done now to prepare for it. How does the bond market work? Contrary to popular misconception, bonds and stocks tend to move together as lower long-term interest rates simultaneously make stocks (especially dividend-paying stocks) more attractive relative to bonds. And as rates go down, bond prices go up. This, incidentally, is one of the key lessons from John Murphy's original work on intermarket analysis, as explained in his book Intermarket Technical Analysis. This condition can be thought of as the process in a normative, mildly disinflationary/inflationary economy. When economies enter extremes of inflation or deflation, this relationship between stocks and bonds can uncouple as factors other than the relative benefits of investing in stocks versus investing in bonds take over. For example, in an environment of runaway inflation, as the one that the US experienced during the late 1970s, bond markets were crushed (bonds bottomed in 1981) with yields streaking into the double digits. At the same time, while stocks were declining in inflation-adjusted terms, the normative bull market that began in 1974 saw stocks double over the next six and a half years. Price action like this is what gives rise to the notion of stocks as "inflation hedges." On the other hand, in an environment of deflation, or even deflationary expectations, a different sort of decoupling occurs. As I wrote years ago in Working Money ("Gibson's Paradox," March 26, 2002), the deflation of 2000-03 was characterized by a plunging stock market and a soaring bond market. Since 2003, while the stock market has soared, the bond market has essentially traded in a range. For all the froth over recent moves in the bond market, such as the recent plunge below 4% in the 10-year note, for example, the reality of a range-bound bond market is available to anyone who can read a price chart.
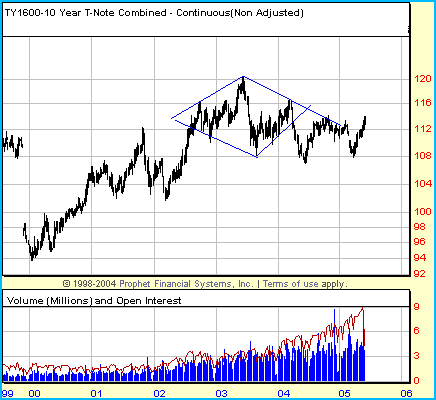
Figure 2: As the stock market topped in 2000, a bull market in bonds emerged. Note the "death star" diamond consolidation.
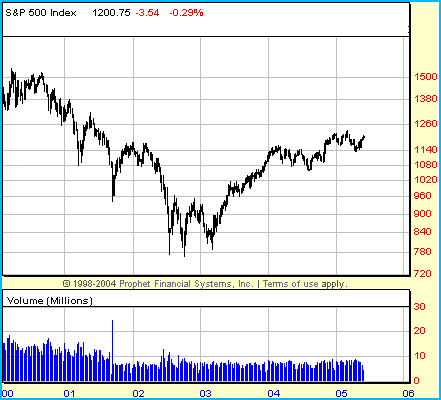
Figure 3: As stocks rallied from the bottom between the autumn of 2002 and the spring of 2003, bonds slipped into a trading range.
This range-bound bond market is the "death star" I've written about from time to time in Traders.com Advantage. (Most recently, "Treasury Diamonds Are Forever," August 13, 2004; "Bad News Bonds," January 7, 2005.) I have believed ever since spotting this diamond consolidation in the 10-year note that it would be difficult for long rates to remain very low for very long. The diamond consolidation, therefore, would act as a diamond top, both limiting upside progress in bond prices (or downside progress in bond yields) as well as marking off a measurement for the near-term breakdown (or breakout, from the yield side of the equation). How does the "death star" appear in light of recent moves in the bond market? And what are the prospects for further price moves in the direction of the current downtrend in rates?
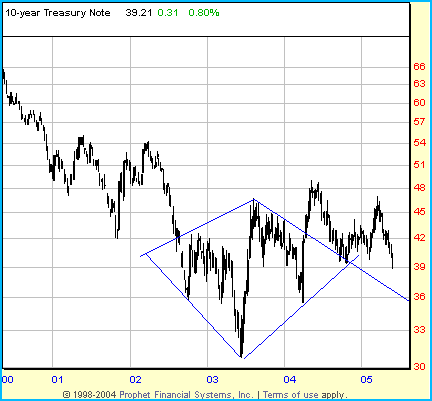
Figure 4: The diamond consolidation in the weekly 10-year note yield or $TNX.
The $TNX lows in the second quarter of 2003 clearly formed an important bottom near 3.2%. Since then, rates shot up above 4.5% in a few months, only to correct back to 3.6% before vaulting up again to set a new high just north of 4.8%. From that new high near 4.8%, rates have fallen again — albeit in a move that was as much or more sideways as downward — to sub-4.0 lows, this time landing nearer to 3.9%. This much and no further? As the chart of the weekly $TNX shows (Figure 4), there is a downtrend line that forms the upper right side of the diamond pattern. Note how the decline from the higher high in the second quarter of 2004 finds support on the back of this downtrend line. If $TNX should continue to fall, then look to see how it reacts upon encountering this downtrend line. There is potential support at 3.6 in the form of the lows from the rally in bonds from the summer of 2003 to the spring of 2004. Interestingly, the downtrend line will be at 3.6% by the end of June. It is also worth noting that $TNX developed negative divergences on the daily charts at the conclusion of its rallies in the third quarter of 2003 and the second quarter of 2004 on the weekly chart. While not essentially, divergences can often be used to anticipate reversals in markets — including the reversal that sprung from the June 2003 bond yield bottom and the bond market crash in 1998. Technically, the $TNX at the weekly level looks like a failed breakout to the upside from a failed diamond bottom. Yet we won't know if the diamond bottom has failed until the lows near 3.2 are taken out. Unless there is a significant change in attitudes toward short-term lending rates, the yield curve will have been long inverted by the time the 10-year note is testing the 3.2% level, let alone dropping below it. Nevertheless, the bullish case on bond prices — or the bearish case on the $TNX, if you prefer — relies on just such an inversion, just such a violation of the 2003 bond yield lows, and just such a record, all-time high price of long-term US government debt. So while the 10-year rate bulls and bears might be stalemated at the present time, there is less doubt that the stakes involved are massive. Nor is there any doubt that the winning side will find its cause quite oversubscribed as those on the losing side of the outcome reverse themselves and get with the program. DEATH STAR OR DOCKING STATION? A part of that answer lies in figuring out just who these investors and speculators are. As many are surprised to learn, those with the greatest appetite for US long-term debt (and the greatest capacity to sate that appetite) are foreign central banks, especially those in Asia. The central banks of nations like Japan, China, and South Korea have used purchases of US Treasuries as a way to "recycle" American dollars earned by virtue of their trade surpluses with the US. In other words, Japan, China and South Korea send products to the US (quite a few of them, in fact). The US provides dollars in return. Then Japan, China, and South Korea turn around and use those American dollars to buy American long-term bonds. Many criticized this relationship, suggesting that it merely sustains imbalances between a "savings short" United States and a "consumption deficient" Asia (translation: Americans spend too much and save too little, while Asians spend too little and save too much). Other criticisms say this relationship contributes to an unfair exchange rate, particularly between the US and China, the latter of which pegs its currency to the movement of the dollar, using purchases of Treasuries to keep their currency from appreciating. As Aravind Adiga wrote in Time Asia a year ago:
The problem with this? As economist Stephen Roach of Morgan Stanley — who himself recently abandoned the "higher interest rates sooner" camp — recently wrote:
Roach also points out that this pattern can continue as long as US interest rates remain high relative to alternatives, writing that "in the end, what foreign creditors seek in a current-account adjustment is a relative premium for taking currency risk ... as long as spreads widen between the US and other international interest rates, that may be sufficient compensation for America's foreign lenders." While the global central banks are clearly the heavyweights in the bond market compared to other participants, the activity of domestic institutions — and even retail investors acting through bond mutual funds — is not insignificant. Roach notes that, with the passing of the equities bull market in 2000, "fixed income instruments have become the new asset class of choice" for fund managers. And as Figure 2 shows, these fund managers have done themselves and their clients quite well. But bond buying has always been a conservative investment relative to alternatives like stocks. And the fact that most of the world seems to be piling into this traditionally conservative asset class begs the question of whether the America's economy might be headed back into the deflationary recessionary environment that characterized the first few years of the bear market in stocks that began in 2000. Further, other observers have wondered whether credit problems in lesser-grade debt — such as that issued by US auto giants Ford and General Motors — have chased fixed-income investors back into the safety of government debt. Another significant fraction of bond bullishness may also be coming from mortgage-backed securities speculators and traders looking to hedge prepayment risk with purchases of Treasuries. So perhaps there is irony in the boasting of economists like Lawrence Kudlow, who sees in our low interest rate environment evidence of the genius of both President George Bush's fiscal policy and Federal Reserve Board chairman Alan Greenspan's monetary policy. Rather than representing an inflation-free nirvana, surprisingly low interest rates on the long endas rates on the short end continue to risemay more represent the late stages of a capital-devouring machine, one that through the nearly risk-free speculation provided by zero or negative interest rates, siphoning off more and more capital from other, more productive uses. As the great market economist and Nobel Prize recipient Friedrich Hayek once observed of inflation, those who inject capital into an economy cannot necessarily control where it goes. In an inflationary, rising interest rate environment, new capital flows quickly toward "things," which tend to increase in value as the unit of account the currency — depreciates. On the other hand, in a deflationary, falling interest rate environment, new capital tends to flow toward financial assets — especially fixed-income financial assets — where the return on investment is greater and swifter. In this latter instance, rather than a perpetual-motion machine, investors and producers are left with a vicious cycle in which lower interest rates lead to greater bond market speculation, which in turn leads to even lower interest rates as the prices of bonds are bid ever higher. For critics of the accommodative monetary regime, the chief casualty has been the productive, manufacturing sectors of the US economy. Economist Gregg Jahnke, who calls himself a "recovering Supply Sideaholic," notes the extreme drain on productive capital caused by the residential mortgage boom. Antal Fekete of the Memorial University of Newfoundland goes farther to suggest that the entire productive capacity of the US is being held hostage by the appetites of the financial sector, writing that:
At the end of the day, the question for technical traders — as well as speculators and investors keying off of technical market information — is whether the consolidation in long-term bond yields from mid-2002 through mid-2004 represents little more than a way station en route to mind-bendingly low interest rates — and a likely inverted yield curve (which would only induce further bond purchases as the economy softened, and even steeper yield curve inversion). Or is the diamond consolidation truly a "death star" looming over decades of bond price appreciation, an anticipation of higher interest rates, and a battle against inflation that has barely been fought — let alone won?
David Penn may be reached at DPenn@Traders.com. SUGGESTED READING Current and past articles from Working Money, The Investors' Magazine, can be found at Working-Money.com. |
Technical Writer for Technical Analysis of STOCKS & COMMODITIES magazine, Working-Money.com, and Traders.com Advantage.
| Title: | Traders.com Technical Writer |
| Company: | Technical Analysis, Inc. |
| Address: | 4757 California Avenue SW |
| Seattle, WA 98116 | |
| Phone # for sales: | 206 938 0570 |
| Fax: | 206 938 1307 |
| Website: | www.traders.com |
| E-mail address: | DPenn@traders.com |
Traders' Resource Links | |
| Charting the Stock Market: The Wyckoff Method -- Books | |
| Working-Money.com -- Online Trading Services | |
| Traders.com Advantage -- Online Trading Services | |
| Technical Analysis of Stocks & Commodities -- Publications and Newsletters | |
| Working Money, at Working-Money.com -- Publications and Newsletters | |
| Traders.com Advantage -- Publications and Newsletters | |
| Professional Traders Starter Kit -- Software | |
PRINT THIS ARTICLE

Request Information From Our Sponsors
- StockCharts.com, Inc.
- Candle Patterns
- Candlestick Charting Explained
- Intermarket Technical Analysis
- John Murphy on Chart Analysis
- John Murphy's Chart Pattern Recognition
- John Murphy's Market Message
- MurphyExplainsMarketAnalysis-Intermarket Analysis
- MurphyExplainsMarketAnalysis-Visual Analysis
- StockCharts.com
- Technical Analysis of the Financial Markets
- The Visual Investor
- VectorVest, Inc.
- Executive Premier Workshop
- One-Day Options Course
- OptionsPro
- Retirement Income Workshop
- Sure-Fire Trading Systems (VectorVest, Inc.)
- Trading as a Business Workshop
- VectorVest 7 EOD
- VectorVest 7 RealTime/IntraDay
- VectorVest AutoTester
- VectorVest Educational Services
- VectorVest OnLine
- VectorVest Options Analyzer
- VectorVest ProGraphics v6.0
- VectorVest ProTrader 7
- VectorVest RealTime Derby Tool
- VectorVest Simulator
- VectorVest Variator
- VectorVest Watchdog


