HOT TOPICS LIST
- Strategies
- Stocks
- Buy
- Investing
- Brokers
- Psychology
- Interviews
- Accumulate
- Sell
- Hold
- Spotlight
- Websites
- Candlestick Corner
- Gold & Metals
- Options Trading
LIST OF TOPICS
TRADER'S NOTEBOOK
CAN SLIM II: The Gold At The End Of The Rainbow
09/07/05 02:52:58 PM PSTby Sharon Yamanaka
Now that you have the CAN, try rearranging your alphabet.
Don't dabble in stocks. Dig in and do some detective work. Sometimes it pays to go to an expert for advice. In this case, however, the expert came to me. Avinash Agrawal is a stock researcher for SierraInvestor.com with a master's degree from Stanford University, where he majored in finance with an emphasis on pricing stocks and derivatives. Having read my first Working Money article on CAN SLIM, Avinash suggested I try a slightly different approach. Previously, I had listed the main characteristics of CAN SLIM as they fall into the method's name:
When asked if he could rank the CAN SLIM criteria from most to least important, Agrawal's answer was to start with the "M" — market direction.
START WITH THE MARKET According to Agrawal, those quality stocks making new highs in price should also be added to your watchlist, "as they may offer buy points while making their first pullback to the 50-day moving average or otherwise consolidating to break out again. Such consolidations last typically seven weeks. So the lower portions of your watch list will have stocks in the consolidation phase, while the top portions are those you are currently watching." CAN SLIM watchlists should be updated regularly, with stocks close to breakout placed near the top of the list. If they don't break out, say within two weeks, or if the breakout fails, move them to the lower portion of your watchlist or remove them altogether. In general, CAN SLIM stocks have the potential to make huge moves of "100% to 300% or more," as Agrawal noted. But when markets themselves are in a trading range and profits are hard to come by, he continued, it's a good idea to take profits around 20% to 25% above your buy point. Keeping all that in mind, the reordered list now reads:
CAN SLIM IN ACTION
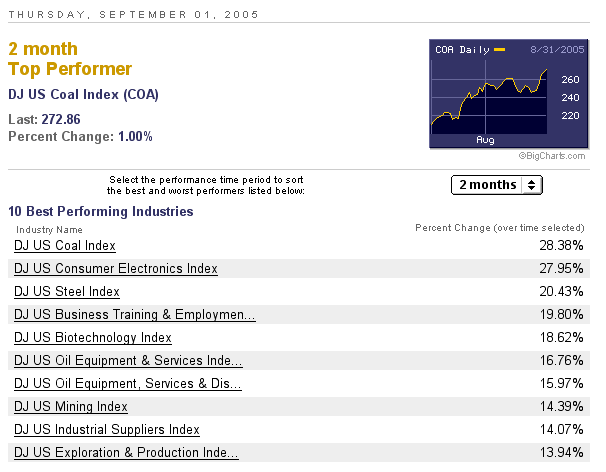
Figure 1: Top-performing sectors from CBS MarketWatch/BigCharts/Industries/Best Performers.
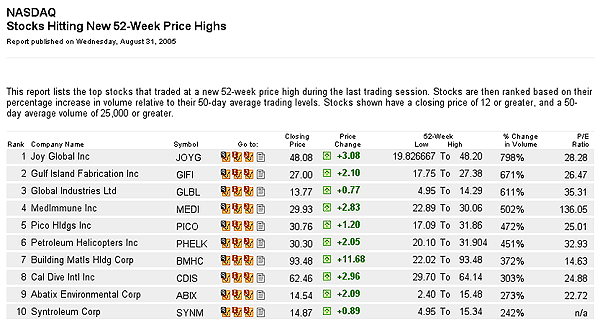
With those sectors in mind, I went to the new 52-week high list (Figure 2). This is where Agrawal said to begin looking for individual stocks. I started with NASDAQ; the Dow Jones Industrial Average (DJIA) list made up of blue-chip companies was less appealing. It would be less likely that one of their stocks would experience any explosive upward growth. And AMEX has smaller, perhaps less stable stocks. NASDAQ it was.
Figure 2: Daily listing of NASDAQ new highs. BigCharts lists the new highs for the day in their "Big Movers: NASDAQ New Highs" list.
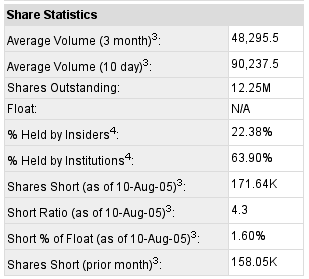
The first stock on the list, Joy Global, Inc., was in the commercial vehicles and trucks industry, not my top 10 list. I decided to move onto the next stock. Gulf Island Fabrications (GIFI) was in the oil and equipment services, a hit on my list, so I looked up their fundamentals. They had 12.2 million shares outstanding, with a market cap of $329 million. That's a small cap — very good. And institutional sponsorship (information I finally found in Yahoo! Finance/Quotes & Info/Key Statistics by clicking on the "More Statistics" button) at 63.9% was a little high, but acceptable (Figure 3).
Figure 3: Institutional interest in GIFI is at 63.9%.
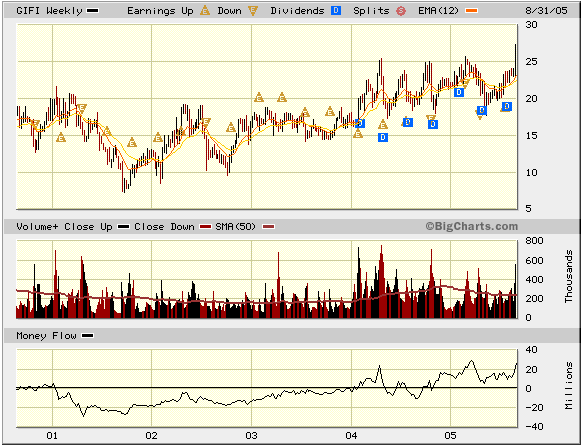
William O'Neil, the founder of the CAN SLIM approach, has a rule of thumb: To buy a stock with a little institutional sponsorship, but not too much. This is one of the more subjective CAN SLIM rules; in addition to the amount, the quality of the sponsorship is important. If you can find out who the sponsors are — institutional sponsors are large buyers such as mutual funds, pension funds, banks, and large money investment firms — then you should be able to tell whether they're "intelligent" buyers. You only want a few, preferably intelligent buyers, because dramatic rises in a stock's price are caused by large institutional buyers, not individual buyers. At this point, I decided to check the sector for leaders and laggards. Of GIFI, 86% was owned by institutions or insiders. That sounded a mite bought-out to me. And without looking up the earnings, the five-year chart didn't show a lot of growth. In fact, it looked flat, like the market (Figure 4).
Figure 4: From a five-year vantage point, you can see how big the breakout and new high were. GIFI had been bouncing off of resistance at $25 for years.
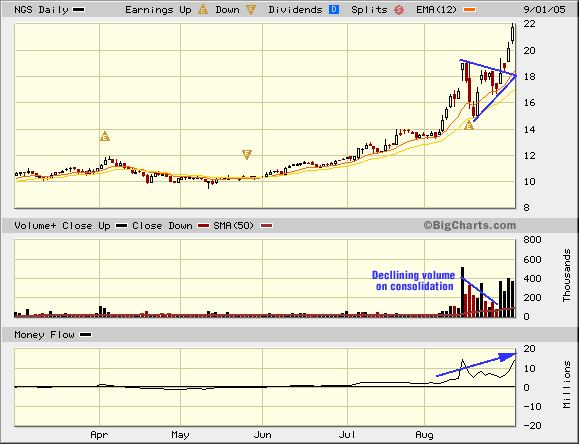
After a little more research, the leader in the oil equipment and services sector's quarterly earnings turned out to be a company called Natural Gas Services Group (NGS) with a 218% increase in profits. GIFI didn't even make the list. Before looking at anything else, I pulled up a chart of NGS (Figure 5).
Figure 5: Six-month chart of NGS. Look at the volume on that thing!
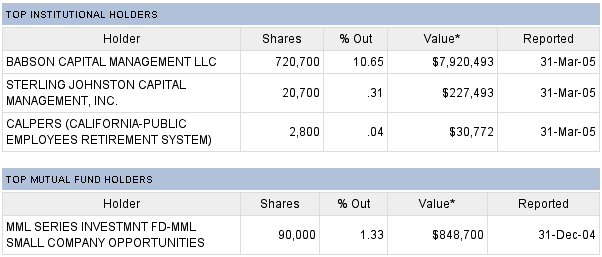
Was I excited? Yes! This was exactly what I was looking for — maybe two days late, but I can buy in on the next pullback. Filling in the rest of the blanks, NGS has 7.1 million shares outstanding, a market cap of $154.32 million, 10.6% institutional sponsorship, and increasing quarterly and yearly profits. Amazingly, Yahoo! lists the institutional owners and when they bought the stock (Figure 6).
Figure 6: Low and recent institutional interest in NGS; 10.5 of the 10.6% institutional sponsorship bought into this stock within the last quarter.
How perfect is that? Now all I have to do is wait for the right entry point.
MONEY MANAGEMENT
The 78% stop-loss is always employed. I take some profits at 20% gain (by selling say half the position) and holding the remainder for a move of say 100% or even more. O'Neil says that if a stock makes a 20% or so gain in eight weeks, it has the potential to make a huge move. Also after taking the 20% profit, if the stock pulls back either near breakout or the 50-day moving average, it can be bought again.
MAKING THE CHANGE
Sharon Yamanaka may be reached at SYamanaka@Traders.com.
SUGGESTED READING Current and past articles from Working Money, The Investors' Magazine, can be found at Working-Money.com.
|
| Title: | Staff Writer |
| Company: | Technical Analysis, Inc. |
| Address: | 4757 California AVE SW |
| Seattle, WA 98116 | |
| Phone # for sales: | 206 938 0570 |
| Fax: | 206 938 1307 |
| Website: | www.Working-Money.com |
| E-mail address: | syamanaka@traders.com |
Traders' Resource Links | |
| Charting the Stock Market: The Wyckoff Method -- Books | |
| Working-Money.com -- Online Trading Services | |
| Traders.com Advantage -- Online Trading Services | |
| Technical Analysis of Stocks & Commodities -- Publications and Newsletters | |
| Working Money, at Working-Money.com -- Publications and Newsletters | |
| Traders.com Advantage -- Publications and Newsletters | |
| Professional Traders Starter Kit -- Software | |
PRINT THIS ARTICLE

Request Information From Our Sponsors
- StockCharts.com, Inc.
- Candle Patterns
- Candlestick Charting Explained
- Intermarket Technical Analysis
- John Murphy on Chart Analysis
- John Murphy's Chart Pattern Recognition
- John Murphy's Market Message
- MurphyExplainsMarketAnalysis-Intermarket Analysis
- MurphyExplainsMarketAnalysis-Visual Analysis
- StockCharts.com
- Technical Analysis of the Financial Markets
- The Visual Investor
- VectorVest, Inc.
- Executive Premier Workshop
- One-Day Options Course
- OptionsPro
- Retirement Income Workshop
- Sure-Fire Trading Systems (VectorVest, Inc.)
- Trading as a Business Workshop
- VectorVest 7 EOD
- VectorVest 7 RealTime/IntraDay
- VectorVest AutoTester
- VectorVest Educational Services
- VectorVest OnLine
- VectorVest Options Analyzer
- VectorVest ProGraphics v6.0
- VectorVest ProTrader 7
- VectorVest RealTime Derby Tool
- VectorVest Simulator
- VectorVest Variator
- VectorVest Watchdog

